| THIS WEEK'S ARTICLES |
| The Market Message |
| Gold is Doing Better Than The World's Major Currencies |
| by John Murphy |
Editor's Note: This article was originally published in John Murphy's Market Message on Friday, July 12th at 11:39am ET.
Gold is more than just a commodity. Gold is sometimes also viewed as an alternate currency. When global traders lose confidence in their currency, they often turn to gold as an alternative store of value. Since gold is quoted in dollars, it rises in value when the dollar weakens. That's one way for investors to preserve their wealth when the Fed starts to lower rates and weaken its currency. Gold recently rose to a six-year high on falling U.S. interest rates which have weakened the dollar (aided by a more dovish Fed). So gold is rising in dollar terms. The true hallmark of a bull market in gold, however, is its ability to rise relative to other major currencies. And it's doing just that.
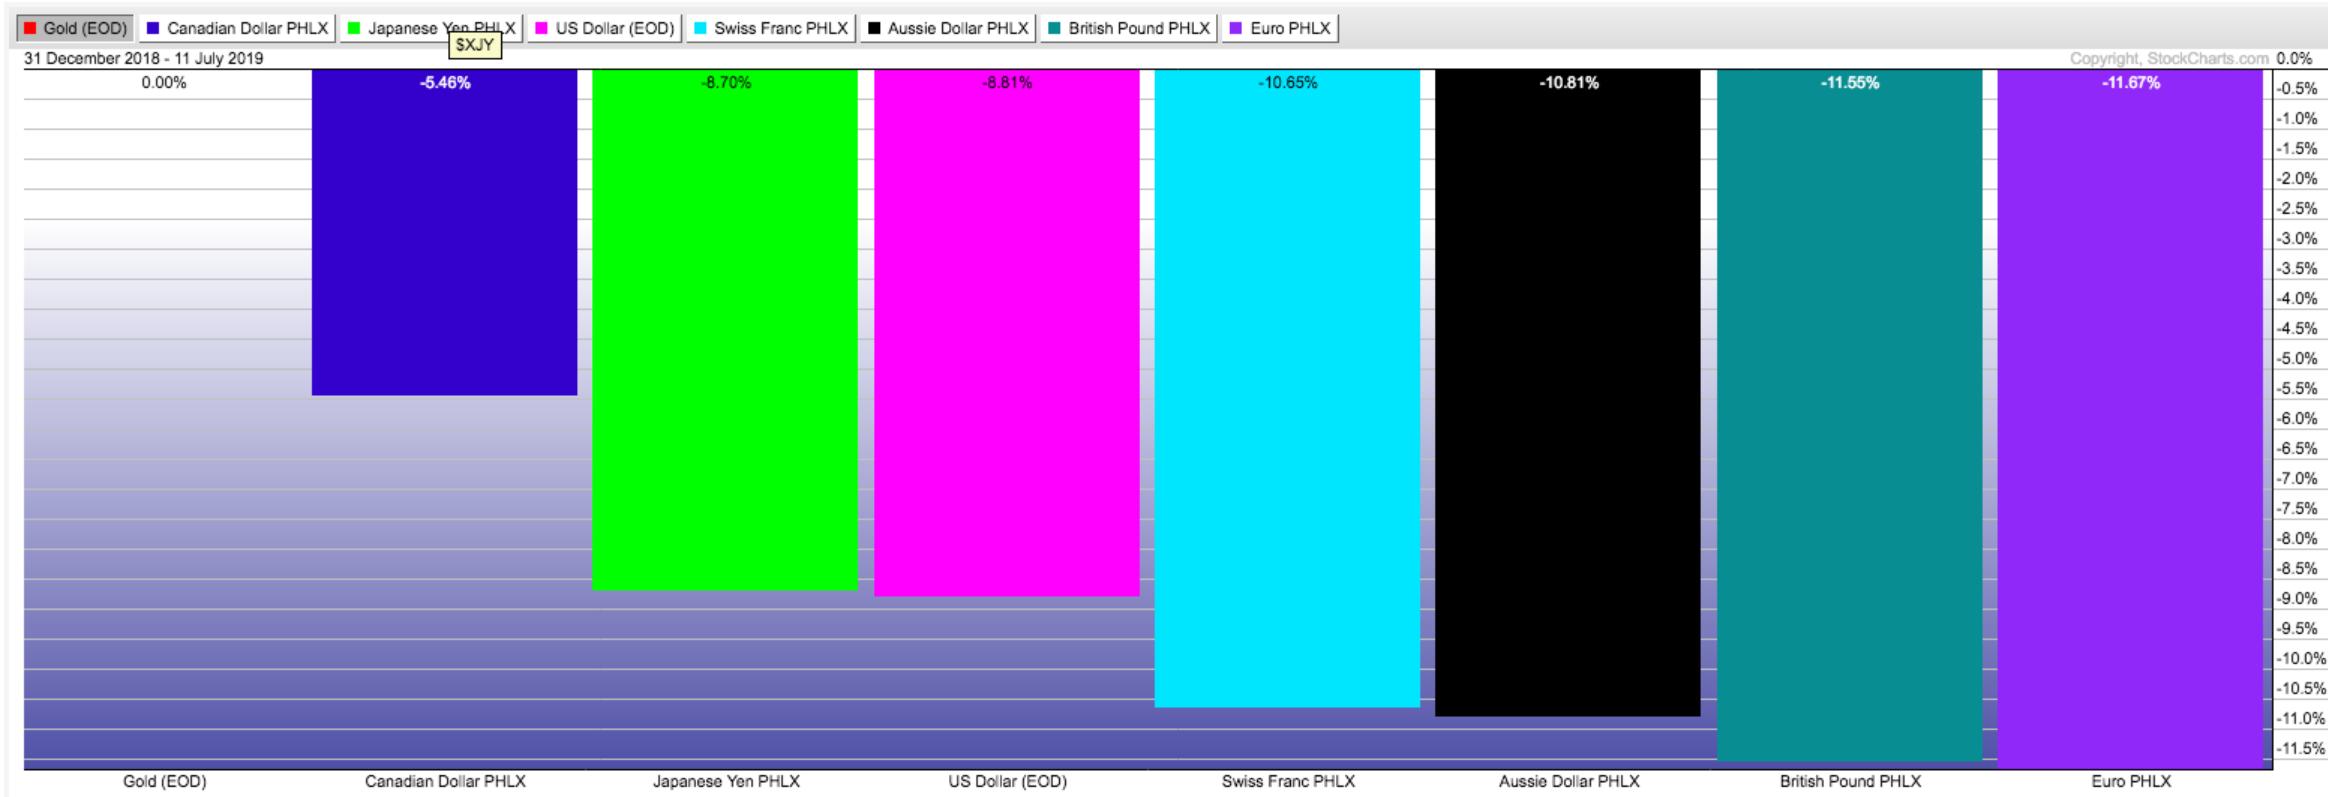
Chart 1 compares this year's performance in the Gold (red bar to the left) relative to the world's major currencies. That includes (in order of relative strength) the Canadian Dollar, Japanese yen, U.S. Dollar, Swiss franc, Aussie Dollar, British pound, and the Euro. And it shows Gold doing better than all of them. Chart 2 is even more graphic by showing those same currencies relative to the price of gold which is plotted as the zero line. Clearly, all of them are losing value relative to gold.
With global growth slowing, central bankers around the world have taken a more dovish turn toward monetary stimulus which usually weakens their local currencies. The Fed is the most recent central bank (and the biggest) to telegraph lower interest rates and a weaker dollar. That may be one of the main reasons that global traders have turned to gold as a new store of value. Since gold is a non-interest bearing asset, it also does better when global rates are dropping.
Chart 1
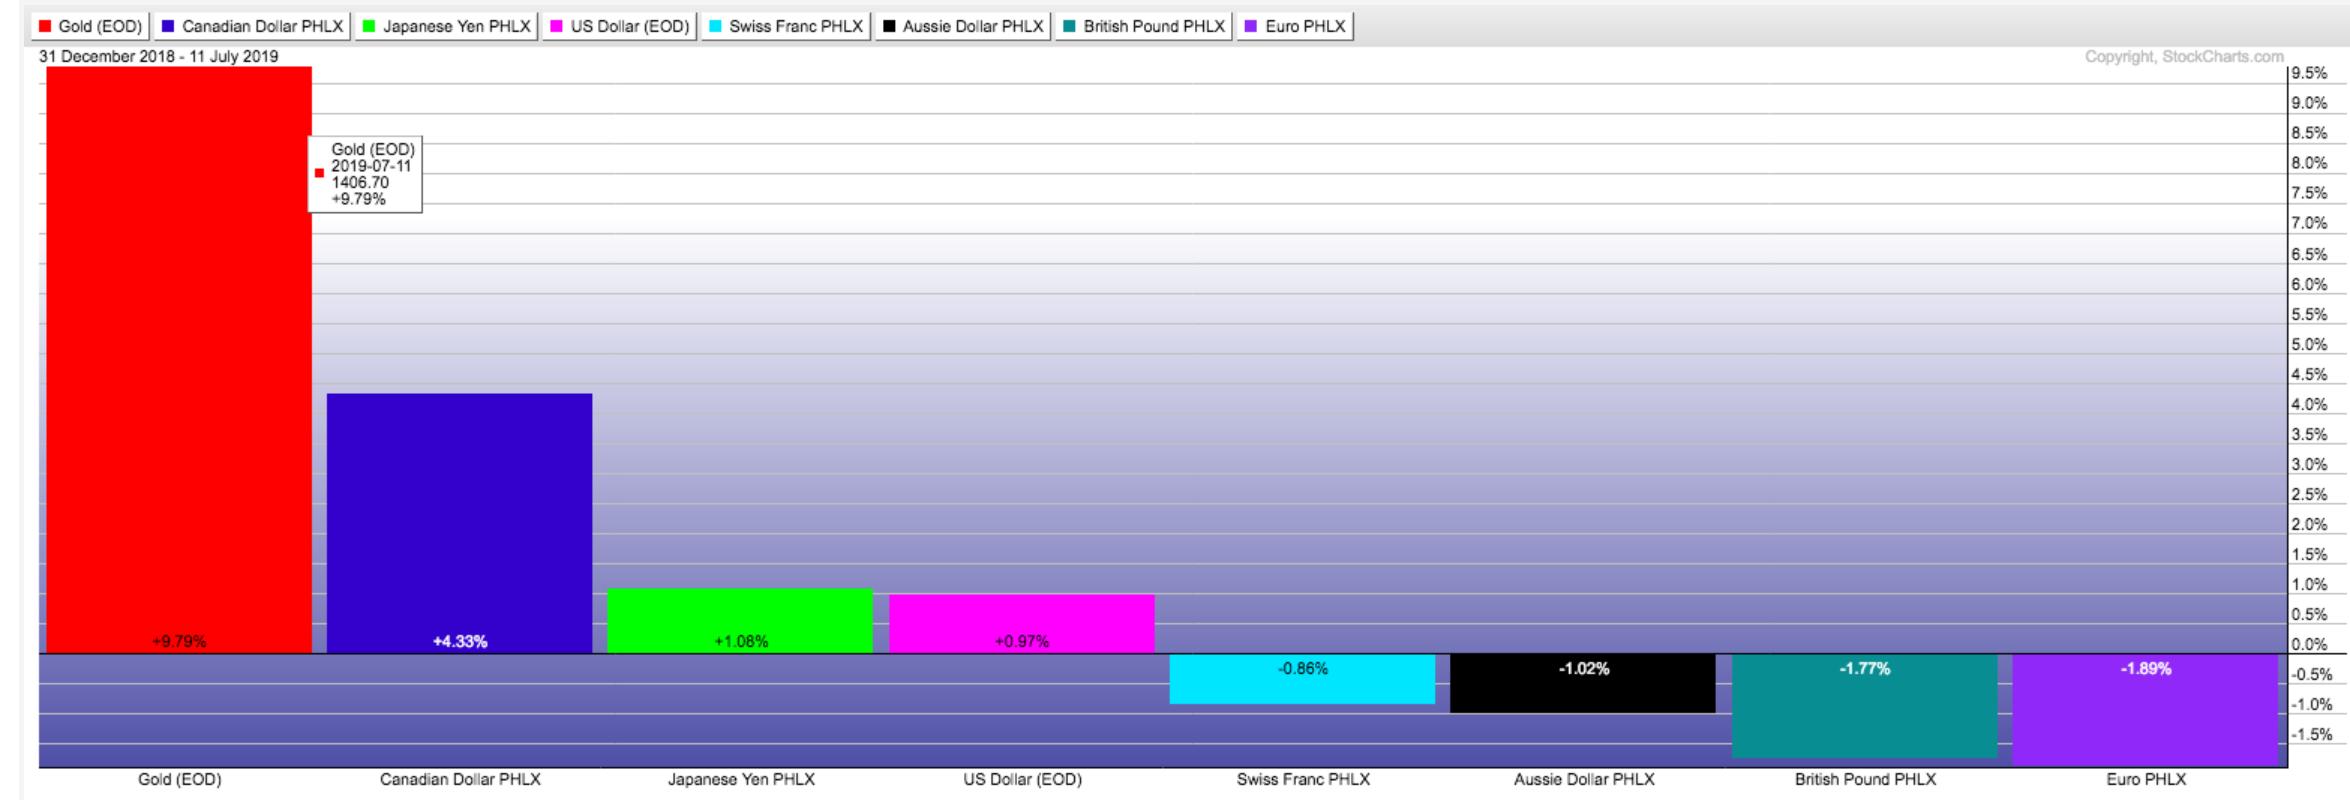
Chart 2
|
| READ ONLINE → |
|
|
|
| Art's Charts |
| Charting Robust AD Lines that Truly Reflect the Broader Market |
| by Arthur Hill |
 The NYSE and Nasdaq are fine as exchanges, but their AD Lines do not tell the entire story when it comes to breadth. The major stock indexes, such as the S&P 500 and S&P Small-cap 600, contain stocks from both exchanges. As such, robust breadth indicators should include stocks from both exchanges and represent the market as a whole, not just one of the two exchanges. Today we will dive into the AD Lines for the NYSE and Nasdaq, and then chart index specific AD Lines, which I consider more robust. The NYSE and Nasdaq are fine as exchanges, but their AD Lines do not tell the entire story when it comes to breadth. The major stock indexes, such as the S&P 500 and S&P Small-cap 600, contain stocks from both exchanges. As such, robust breadth indicators should include stocks from both exchanges and represent the market as a whole, not just one of the two exchanges. Today we will dive into the AD Lines for the NYSE and Nasdaq, and then chart index specific AD Lines, which I consider more robust.
Breadth indicators are important because they measure the degree of participation. Advance-Decline Lines are cumulative measures of net advances (advances less declines). These lines rise when advances outpace declines and fall when declines outnumber advances. An AD Line that is rising and making new highs reflects strong upside participation and this is bullish overall.
I am also not a fan of NYSE and Nasdaq breadth indicators because there are quite a few "suspect" listings. According to Nasdaq.com, and our own symbols ($NYTOT and $NATOT), both the NYSE and Nasdaq have over 3000 listings. The NYSE has over 700 non-stock listings, such as funds, preferreds and trusts, while the Nasdaq has over 600 stock listings with a market cap less than $50 million. Talk about tiny! These non-stock listings and low market caps can distort the AD Lines.
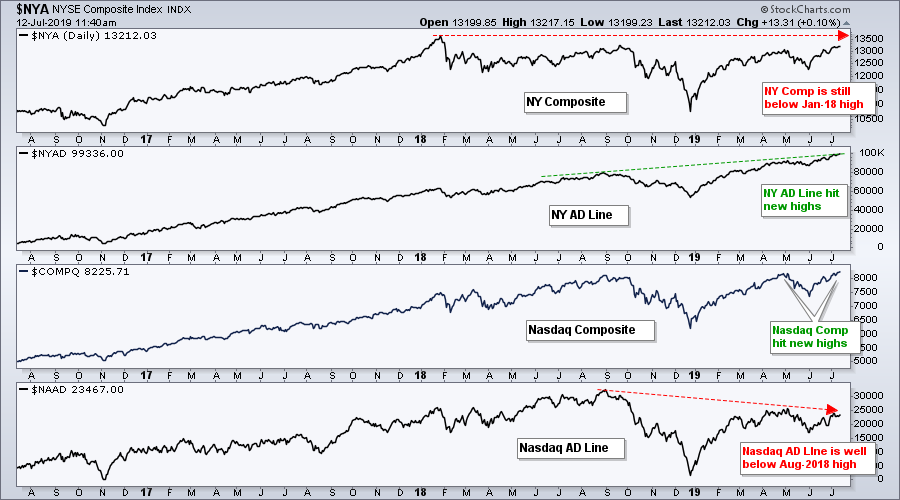
The chart above shows the NY Composite, the NYSE AD Line, the Nasdaq and the Nasdaq AD Line. The NY Composite has yet to exceed its January 2018 high, but the NYSE AD Line recorded new highs in the third quarter of 2018 and throughout 2019. The Nasdaq also moved to new highs over the last few months, but the Nasdaq AD Line remains well below its 2018 highs. Some may call it divergence, but clearly these AD Lines are not in sync with their underlying indexes.
Thursday's On Trend show covers the topics
in this commentary and more on breadth.
Click here to watch on Youtube.
Nasdaq and NYSE breadth indicators are not representative of the indexes we follow and the ETFs we actually trade (SPY, MDY, IJR). Consider the following: The S&P 500 has 370 NYSE stocks (74%) and 130 Nasdaq stocks (26%), the S&P Mid-Cap 400 has 268 NYSE stocks (67%) and 132 Nasdaq stocks (33%), and the S&P Small-Cap 600 has 281 NYSE stocks (47%) and 319 Nasdaq stocks (53%). The S&P 500 and S&P Mid-Cap 400 are more weighted toward NYSE stocks, while the S&P Small-Cap 600 is more weighted towards Nasdaq stocks.
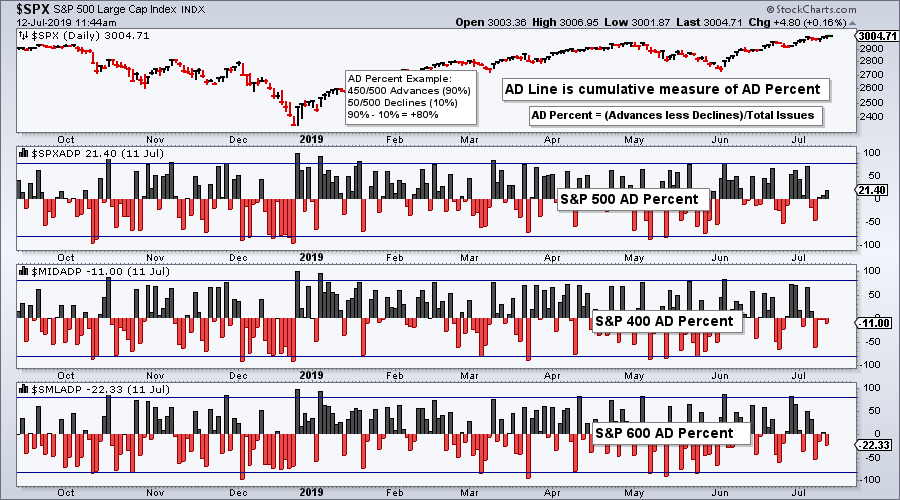
StockCharts calculates and publishes advance-decline indicators that are representative of the stock indexes we follow and ETFs we trade. The chart below shows AD Percent for the S&P 500, S&P Mid-Cap 400 and S&P Small-Cap 600. AD Percent is net advances divided by total issues. Showing net advances as a percentage of total issues allows us to compare the values.
The next chart chart uses AD Percent to create the AD Lines. The S&P 500 AD Line hit a new high first in late January as large-cap breadth showed upside leadership. The S&P Mid-Cap 400 AD Line followed suit in early February with a new high and the S&P Small-Cap 600 AD Line hit a new high on February 20th.
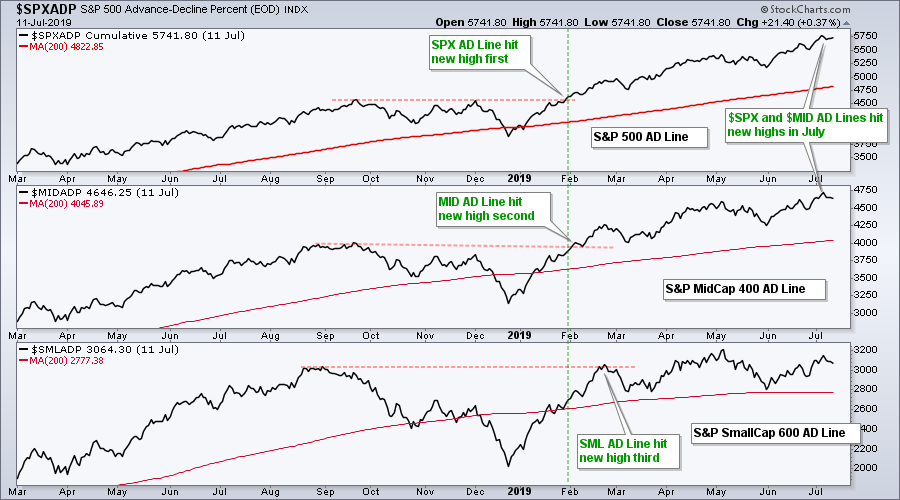
The S&P 500 and S&P Mid-Cap 400 AD Line hit new highs again in July, but the S&P Small-Cap 600 AD Percent remains below its May high. Even though small-cap breadth is lagging, I would not be concerned because the other two hit new highs. Thus, two of the three are strong and this means the weight of the evidence is clearly bullish.
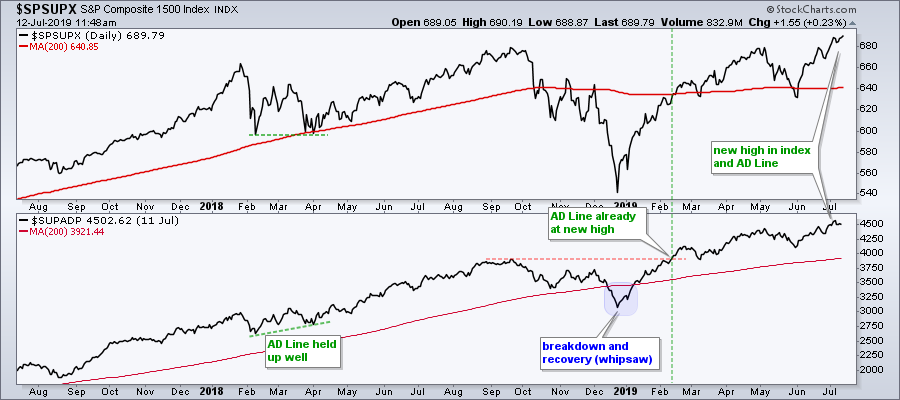
We can take these indicators one step further by combining the S&P 500, S&P Mid-Cap 400 and S&P Small-Cap 600 to create on broad index. Taken together, the S&P 1500 represents a broad array of common stocks and is ideally suited for breadth indicators. This index includes large-caps, mid-caps, small-caps, NYSE stocks (61%) and Nasdaq stocks (39%). The chart below shows the S&P 1500 AD Line hitting a new high in July and confirming the new high in the S&P 1500 ($SPSUPX).
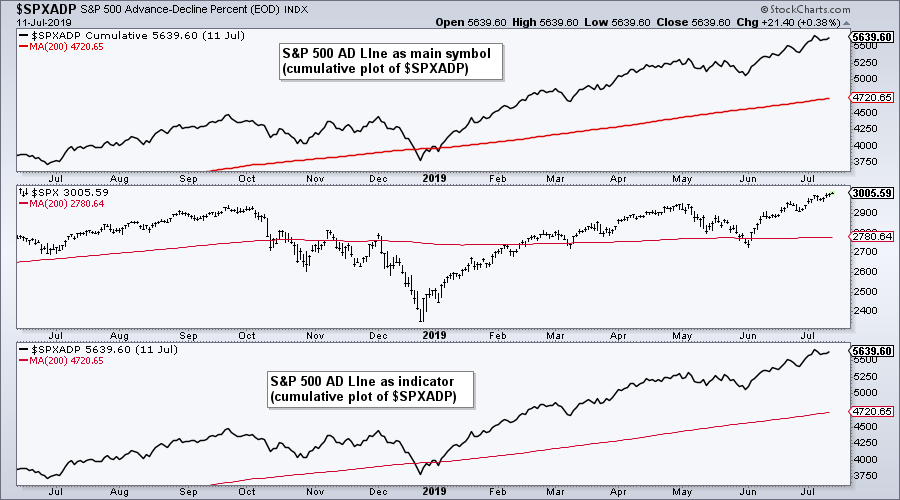
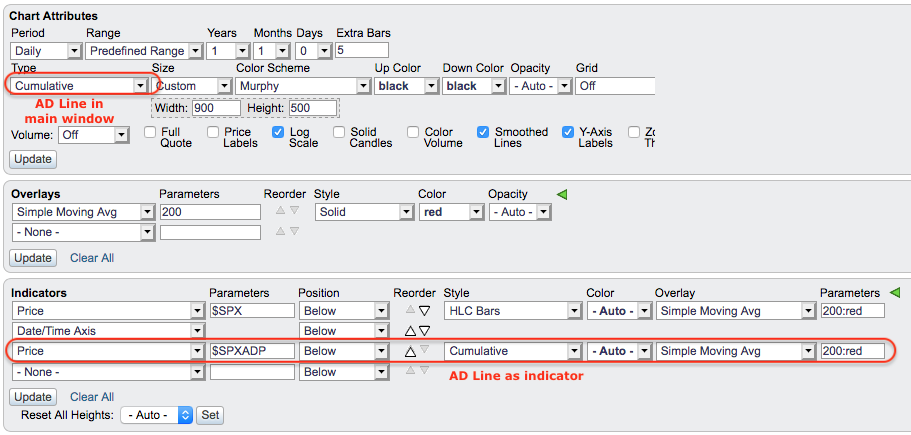
StockCharts members can chart the AD Lines for the major stock indexes and the eleven sector SPDRs. Click here for the symbols. After entering the AD Percent symbol, choose cumulative as the chart "type" when plotted as the the main symbol or "style" when plotted as an indicator. The chart below shows an example of the $SPX AD Line as the main symbol and as an indicator. The image below the chart shows the SharpChart settings. Remember, StockCharts members can click on the chart to open it and save it to their favorites list. Yes, a StockCharts membership has its advantages.
On Trend on YouTube (Thursday, July 11th)
- NYSE is Not Representative of the Market
- Charting Up/Down Pairs and AD Lines
- NYSE and Nasdaq AD Lines Diverge
- Plotting Breadth Indicators that Represent the Market
- Click here to Watch
Arthur Hill, CMT
Senior Technical Analyst, StockCharts.com
Book: Define the Trend and Trade the Trend
Paper: RSI for Trend-Following and Momentum Strategies
Want to stay up to date with the latest market insights from Arthur?
– Follow @ArthurHill on Twitter
– Subscribe to Art's Charts
– Watch On Trend on StockCharts TV (Tuesdays / Thursdays at 10:30am ET)
|
| READ ONLINE → |
|
|
|
|
|
| The Mindful Investor |
| Mindful Investors Minimize Distractions |
| by David Keller |
 When you're a student pilot, your first couple of solo flights remain very close to your home airport. Basically, you get up in the air and do a couple laps around the landing pattern. This is meant to get you comfortable being in the plane by yourself, as well as help you gain confidence for the long solo flights. When you're a student pilot, your first couple of solo flights remain very close to your home airport. Basically, you get up in the air and do a couple laps around the landing pattern. This is meant to get you comfortable being in the plane by yourself, as well as help you gain confidence for the long solo flights.
The long solo is where you actually travel away from your airport and go somewhere else. This involves navigation, communication with air traffic control and many other moving parts. Honestly, it ends up being fairly overwhelming.
For my first long solo, I took off from Norwood, which is a great airport to the southwest of Boston. I was then set to fly due east over to Marshfield, right on the ocean, then take a right turn to head southeast, ultimately landing at Hyannis.
The takeoff went well, after which I turned due east to Marshfield, then southeast to Hyannis. That leg of the journey took me right over the water. I remember being absolutely captivated by the moment. I could see all of Cape Cod, the ocean and even Rhode Island off my right wing. Beautiful clear sky.
All of a sudden, I looked back and noticed the Hyannis airport off in the distance, getting larger and larger in front of me. I realized I had neglected to radio Hyannis Tower to let them know I was en route. Even worse, I completely forgot the radio frequency that I was given from the previous controller.
The good news is that I was taught to write all frequencies down on my kneeboard, so I glanced down at my notes, switched to the correct frequency and announced my intentions. Crisis averted.
One of the worst things you can do as a pilot is become distracted. When that happens, you lose your situational awareness, the recognition of what’s happening all around you. A distracted pilot is an ineffective and arguably dangerous pilot.
As investors, we need to maintain a good situational awareness of what’s happening around us and our portfolio. I often call this “market awareness” and it’s about having a good sense of what’s moving and why. It’s so easy to put on the blinders and forget that there’s a whole market moving around your positions!
So, how do you minimize distractions as an investor?
First, give yourself a focused time to get your priorities in line. Think through the things that you need to accomplish in a given week. Write them down and review them regularly.
I look at a lot of charts, hundreds if not thousands every day. It’s very easy to get caught in “stream of consciousness” mode, jumping mentally from one thing to the next with no real purpose in mind.
I developed a morning coffee routine with a set of charts that I review, in order, every day. I’ve learned that if I start every day with this process, I can more easily track trends and identify inflection points.
Every once in a while, I review all the charts in my daily list and look for ways that I can improve my process. Sometimes I’ll add a chart or two, and sometimes I’ll remove one that no longer speaks to me. More often than not, I don’t change anything and simply confirm that I’m looking at the right content every morning.
Second, have a solid plan for each day. Set it ahead of time and write it down.
I like to break down my daily schedule like a football game, with specific tasks laid out for pregame, each of the four quarters and a postgame period. This helps me to focus on my key priorities and keep coming back to the things that I know will be most valuable to my work.
Finally, don’t forget to take a step back once in a while. Don’t get so focused on your investment process, your trading plan and the flickering ticks of the markets that you forget why you put in all of that effort.
For me, I focus on things like music, mindfulness, my family, my faith. I never want to become so engrossed in my investment strategy that I neglect the things that are truly the most important in my life.
Distractions happen, for pilots as well as investors. Mindful investors minimize distractions by setting their priorities, developing a good daily plan and taking time to reflect on what’s most important.
RR#6,
Dave
David Keller, CMT
President, Sierra Alpha Research LLC
Disclaimer: This blog is for educational purposes only and should not be construed as financial advice. The ideas and strategies should never be used without first assessing your own personal and financial situation or without consulting a financial professional.
The author does not have a position in mentioned securities at the time of publication. Any opinions expressed herein are solely those of the author and do not in any way represent the views or opinions of any other person or entity.
|
| READ ONLINE → |
|
|
|
| Earnings Beats |
| Two Stocks Setting Up To Report Blowout Earnings Next Week |
| by John Hopkins |
On Thursday morning, Delta Airlines (DAL) blew past revenue and EPS estimates, despite a challenging environment for airline stocks ($DJUSAR) in 2019. While DAL's results may have surprised quite a few people, they didn't surprise me. The best way to follow where Wall Street is placing their bets is not by watching CNBC - rather, it's by following relative strength on the charts, as that tells us where big money is investing. Keep in mind that investment firms like Goldman Sachs send their analysts to meet with company management teams to find out the latest regarding their outlook. After those meetings, they return to their office and invest clients' money. When you see companies outperforming their peers and the benchmark S&P 500, it's generally a good signal that a company is exceeding Wall Street's expectations.
Let's look at how Wall Street was treating DAL heading into their quarterly earnings report:
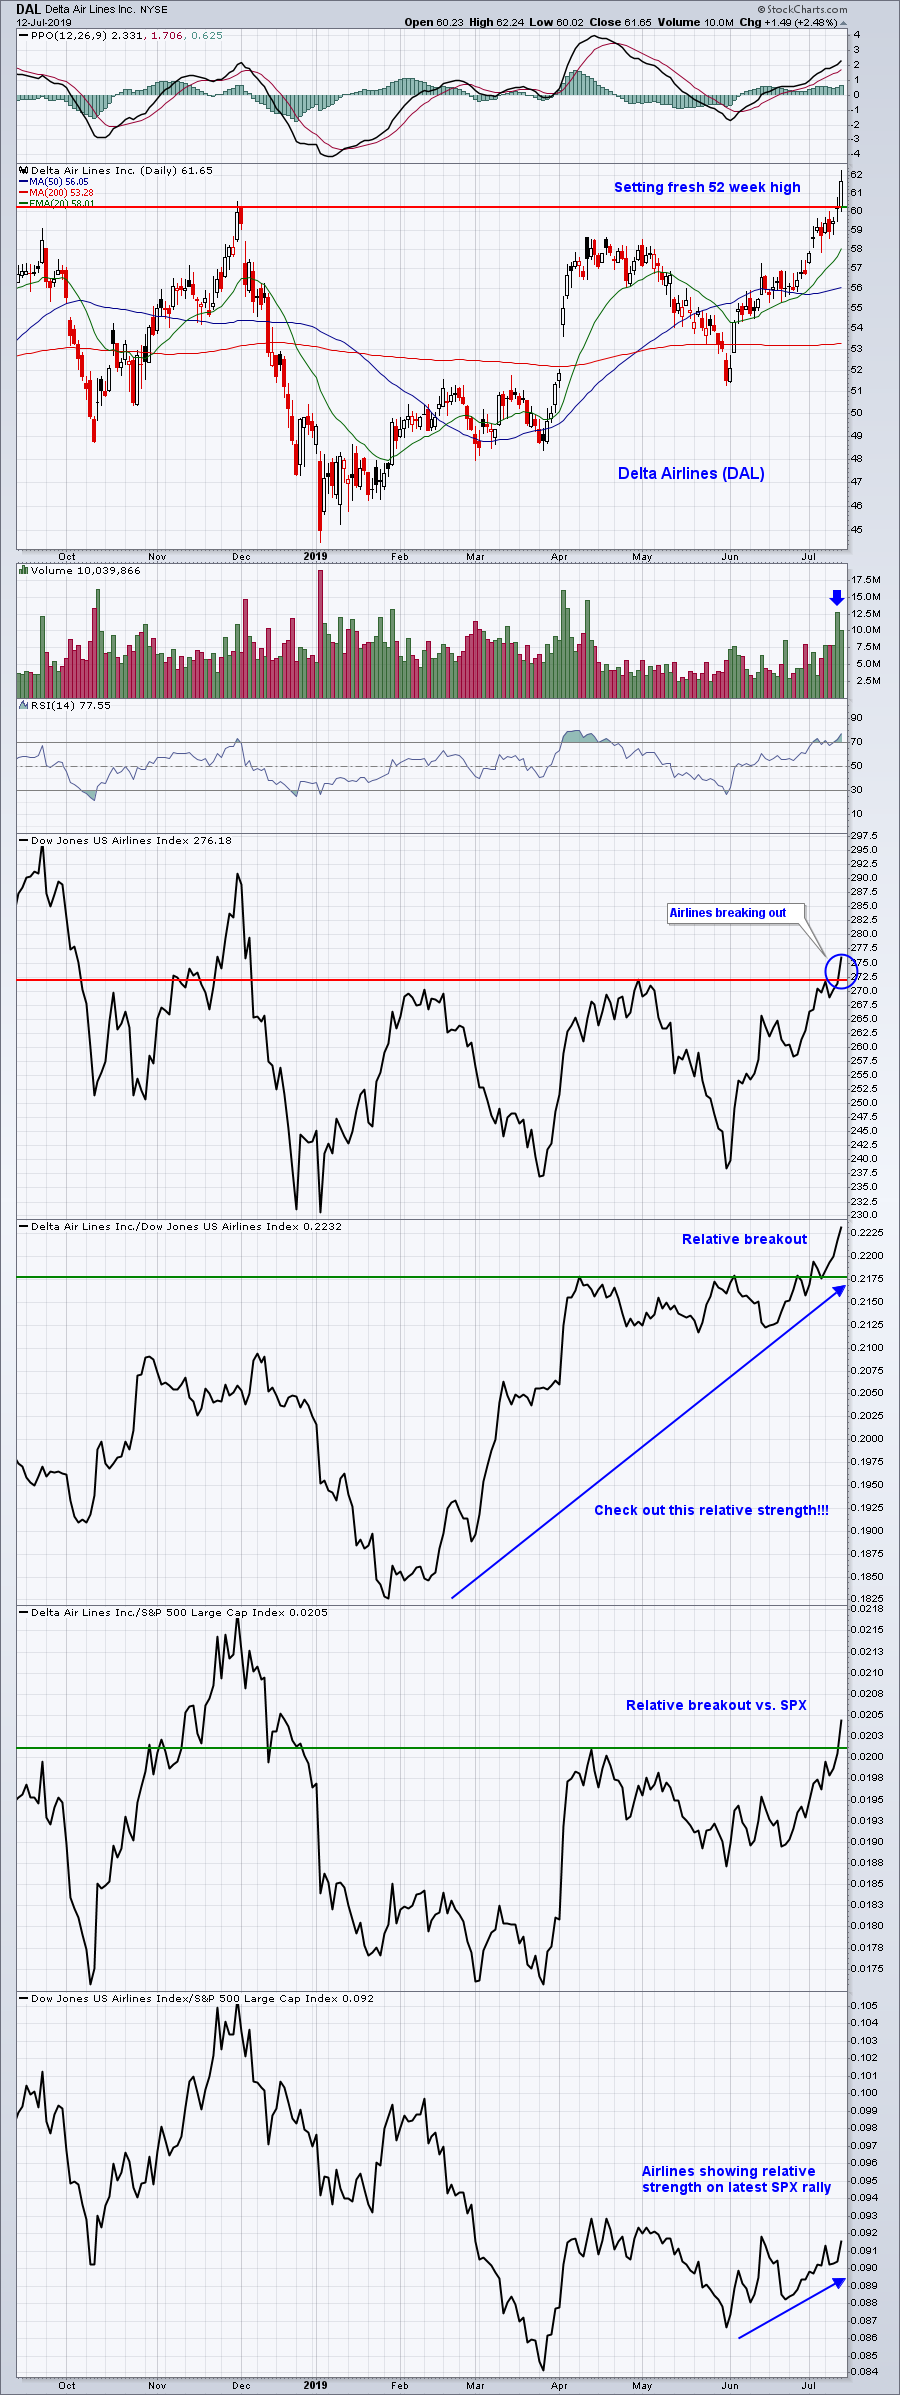 DAL was a leading stock, very strong relative to its airline peers. It was even outperforming the S&P 500 despite a poorly-performing airline group. Wall Street was pouring its money into DAL on a relative basis - we need to be aware of this! DAL was a leading stock, very strong relative to its airline peers. It was even outperforming the S&P 500 despite a poorly-performing airline group. Wall Street was pouring its money into DAL on a relative basis - we need to be aware of this!
Now, we have a big week of earnings ahead as Q2 earnings season kicks off. Which companies appear to be poised to report record results like DAL?
1. Cintas Corp (CTAS)
This $25 billion industrial company has been sizzling right along, gaining more than 50% since the December low and, this week, breaking further into record-high territory. It's not just the absolute gains that are impressive, however, as the company's relative strength has been phenomenal. Wall Street loves CTAS and so should we:
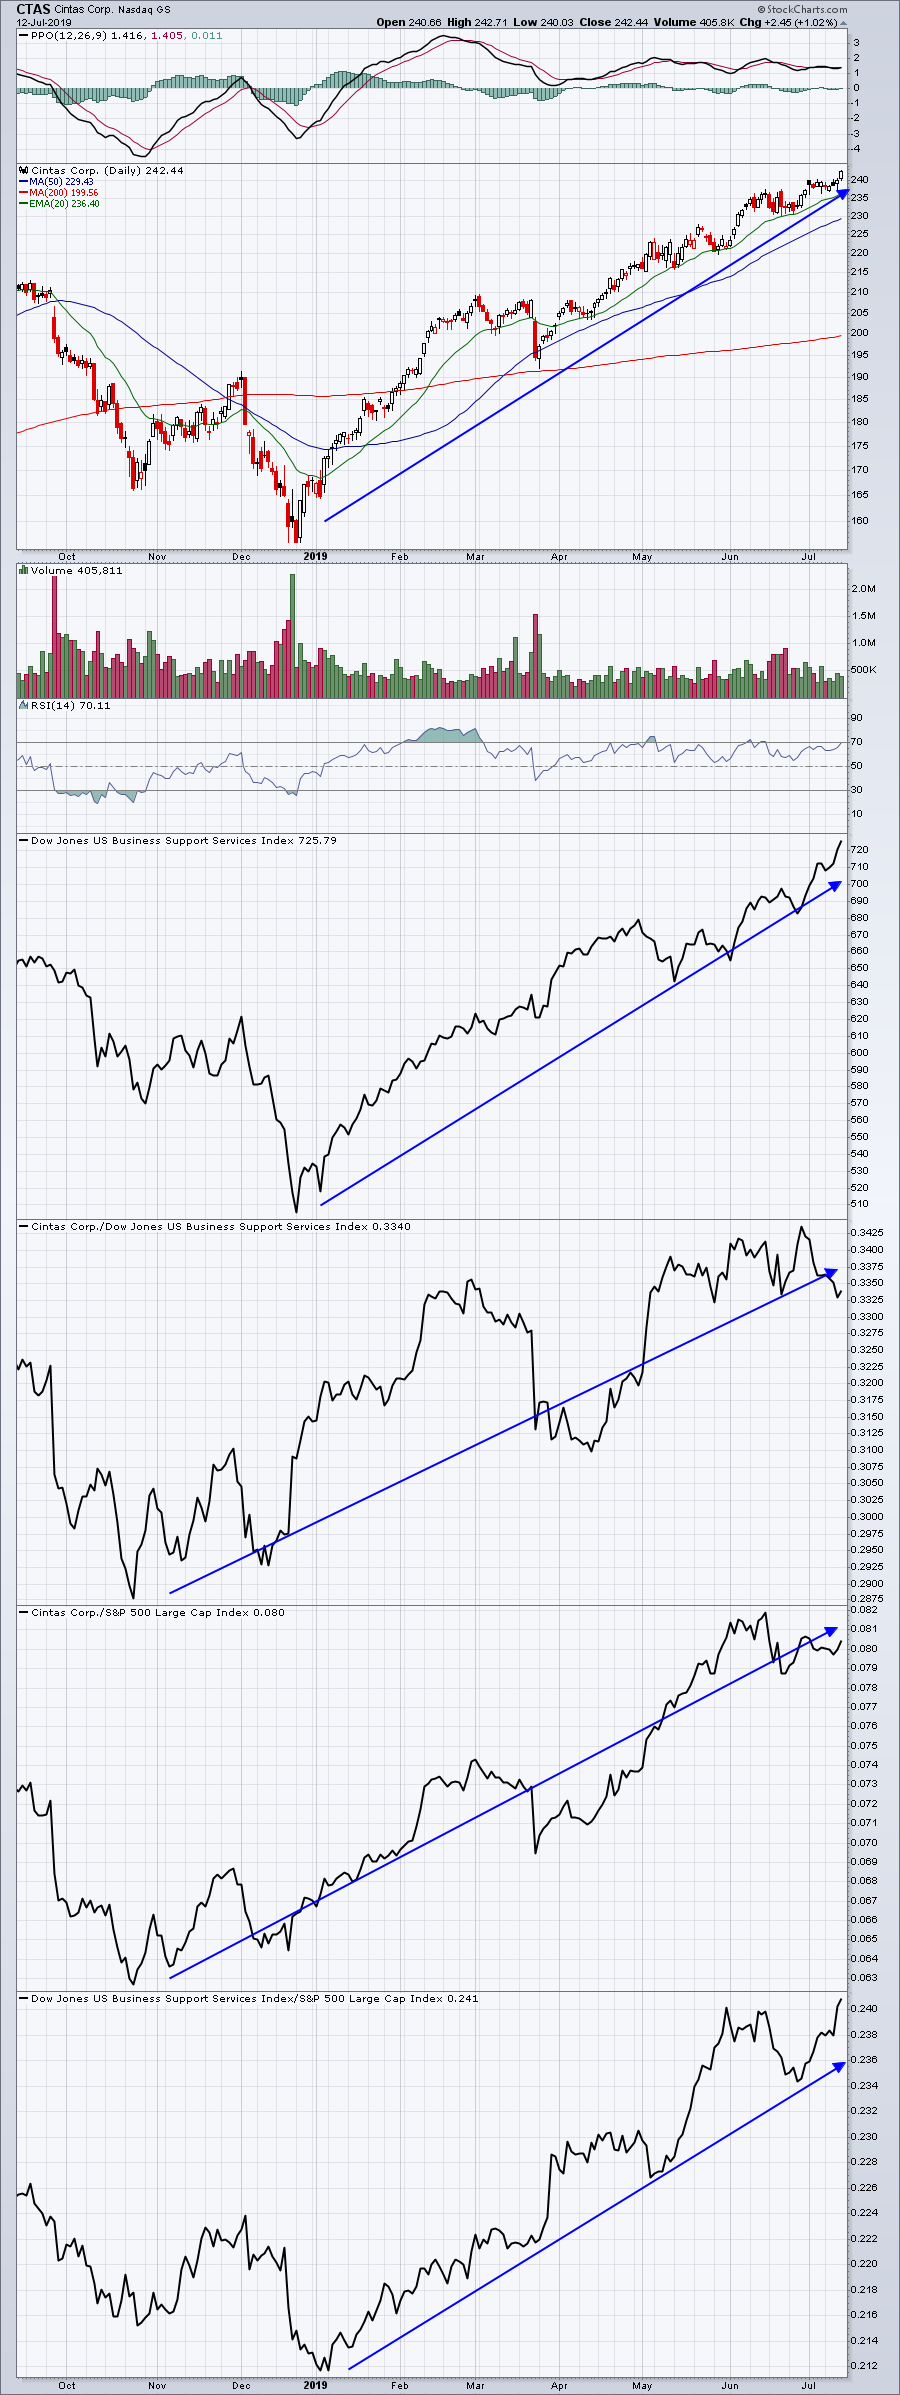 When you're a relative leader in one of the leading industries, Wall Street is placing a ton of confidence in a very solid upcoming earnings report. Expect a blowout. When you're a relative leader in one of the leading industries, Wall Street is placing a ton of confidence in a very solid upcoming earnings report. Expect a blowout.
2. Danaher Corp (DHR)
DHR is a $100 billion medical equipment company. The group ($DJUSAM) recently set a new 52-week relative high and DHR has been an excellent relative performer in 2019. I expect to see above-consensus results from this leader. Here's the current chart:
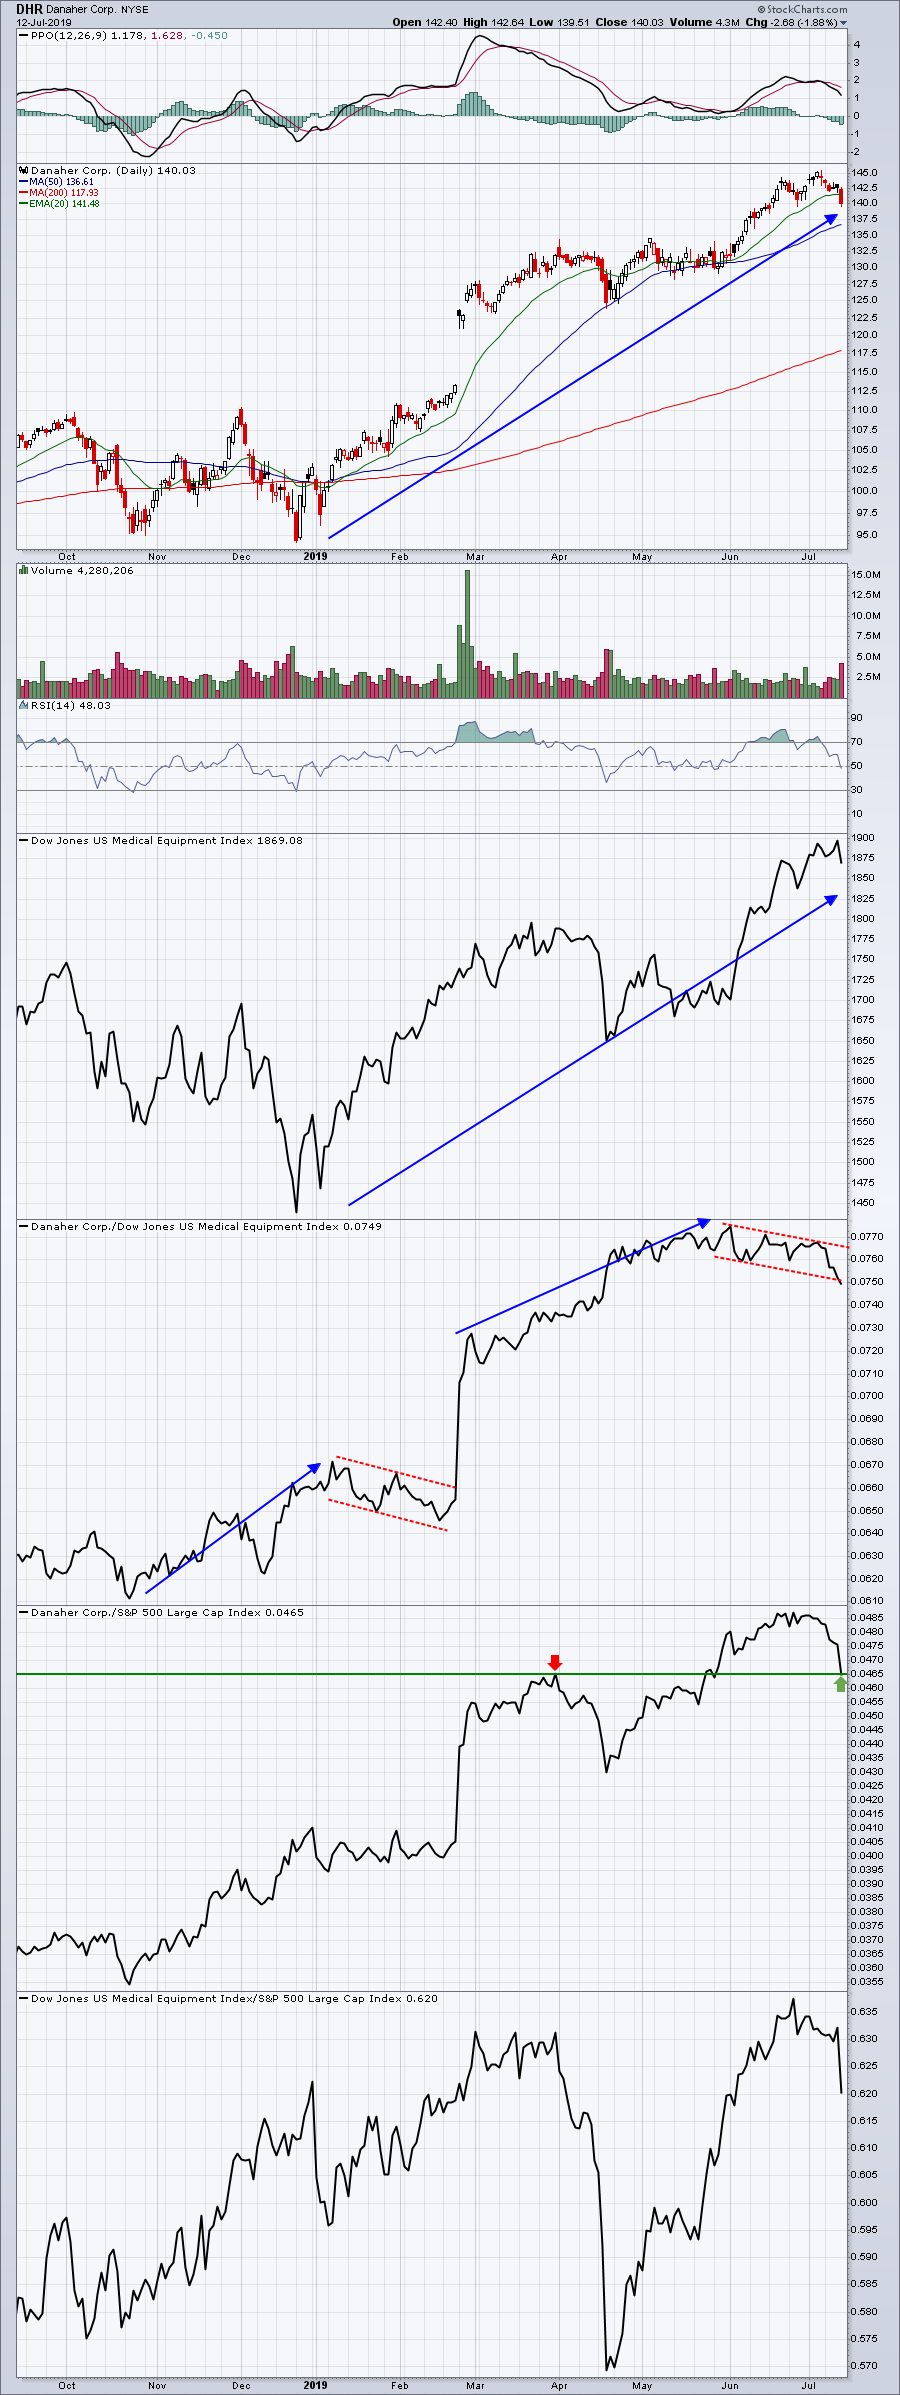 DHR showed some relative profit-taking earlier this year prior to a massive gap higher. I'm expecting something similar here. DHR has been an exceptional medical equipment company for a long time and Wall Street seems to be predicting another big quarter. I agree. DHR showed some relative profit-taking earlier this year prior to a massive gap higher. I'm expecting something similar here. DHR has been an exceptional medical equipment company for a long time and Wall Street seems to be predicting another big quarter. I agree.
Now, let's turn our attention to relative weakness for a moment.
Want a stock that seems like it's headed for a disastrous report? Check out Alliance Data Systems (ADS). It's in the financial administration ($DJUSFA) area, which has been one of the best industry groups for the past two years. If you're downtrending in an environment that's been so favorable for financial administration stocks, what are you hiding in your closet? We may find out next week. This clue is enough to keep me away:
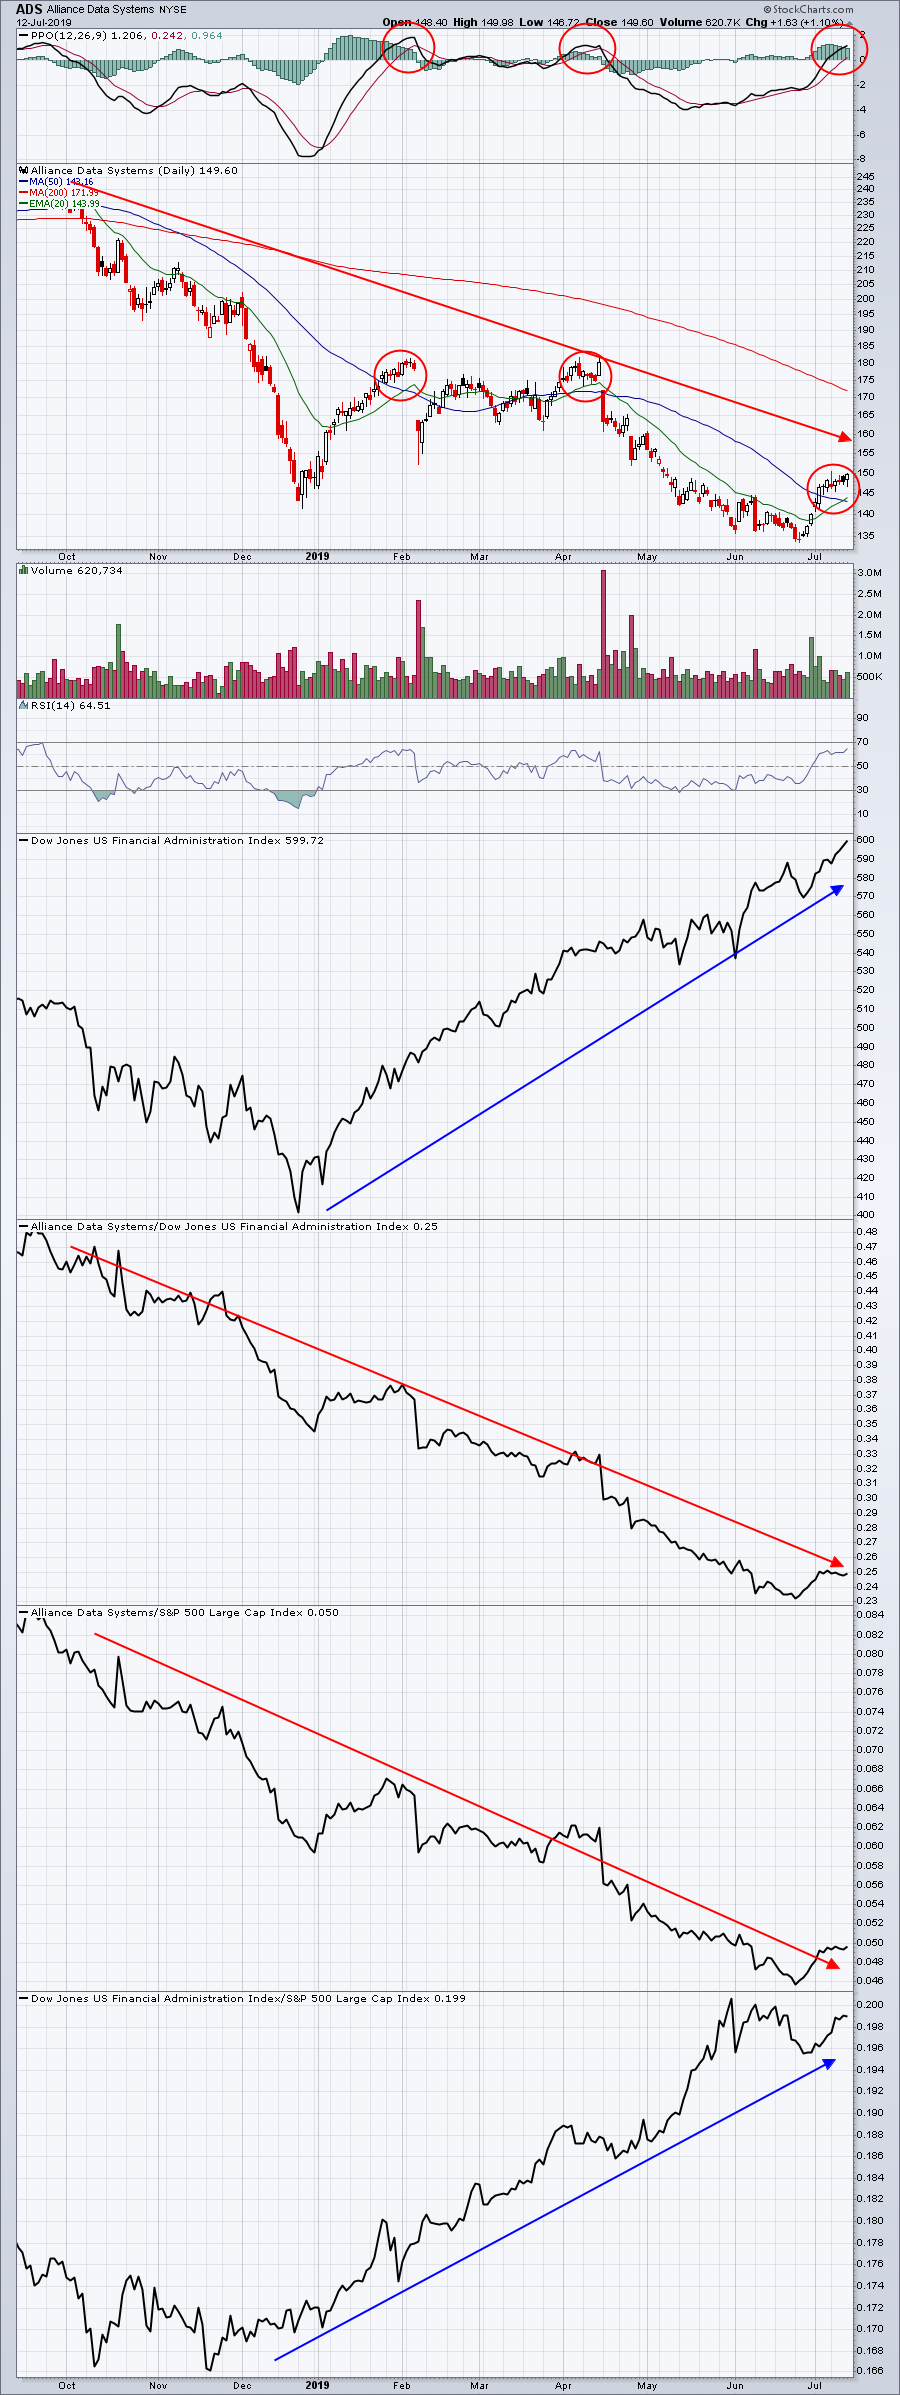 Now, before you talk about how the technical outlook has changed with the recent move back above key moving averages and the PPO turning positive, refer to those red circles back in February and April. The same technical improvements occurred just before the bottom dropped out. I'd be very careful with a stock like ADS - at least until we see improving fundamentals and some lasting relative strength. Now, before you talk about how the technical outlook has changed with the recent move back above key moving averages and the PPO turning positive, refer to those red circles back in February and April. The same technical improvements occurred just before the bottom dropped out. I'd be very careful with a stock like ADS - at least until we see improving fundamentals and some lasting relative strength.
At EarningsBeats.com, we never lose focus on what Wall Street is doing with their money. Relative strength provides the clues we need to be better traders. Tom Bowley, Senior Technical Analyst at StockCharts.com, joined the EarningsBeats.com community earlier this week to provide his 2019 2nd Half Market Outlook, which we recorded. If you sign up for our FREE newsletter that focuses on earnings and relative strength, we'll provide you a link at no charge so that you can review the webinar at your leisure. CLICK HERE to sign up.
At your service,
John Hopkins, President
EarningsBeats.com
|
| READ ONLINE → |
|
|
|
| SPECIAL EVENT ANNOUNCEMENT |
| Calling all Chicago-area investors and traders! Our very own Greg Schnell will be speaking at the upcoming TradersEXPO in Chicago next month, July 21st - 23rd. Not only is this one of the summer's premier financial events, but it's also free to register and attend. In addition to a long list of incredible speakers, you can hear Greg share his latest market analysis, see the charts he's watching most closely and meet the man himself in person. Click the banner below to learn more and register. |
 |
| LEARN MORE → |
|
| The Traders Journal |
| My Personal Story And Why I Ask For Your Help |
| by Gatis Roze |
 This is a true story about someone whom I’ll refer to as an investing “refutenik”. But first, a bit of background. The long-term financial viability of Social Security is questionable, yet some politicians like to toss around the idea of delegating more accountability to John Q. Public for taking responsibility for his or her own retirement well-being, In expecting people to embrace both regimented savings and disciplined investing, I’m reminded of a famous quote about democracy that I’ll just paraphrase: “The best argument against encouraging the citizenry to be responsible for financing their own retirement is a five-minute conversation with the average American.” This is a true story about someone whom I’ll refer to as an investing “refutenik”. But first, a bit of background. The long-term financial viability of Social Security is questionable, yet some politicians like to toss around the idea of delegating more accountability to John Q. Public for taking responsibility for his or her own retirement well-being, In expecting people to embrace both regimented savings and disciplined investing, I’m reminded of a famous quote about democracy that I’ll just paraphrase: “The best argument against encouraging the citizenry to be responsible for financing their own retirement is a five-minute conversation with the average American.”
Bear with me; you’ll see where I’m going with this. I’ll share with you a personal story and then explain why I ask for your help . If you’re reading this blog, my bet is that you’re already more financially savvy than 95% of the citizenry. I feel that kind of blessing comes with a certain community responsibility.
I know for a fact that there exists an entire ocean of investor refuteniks out there. My firsthand story is about one such individual. Name changed, of course, but the facts are indeed based on my interactions with this person over nearly 15 years.
Barbara has been a business acquaintance for more than a decade, and as such, she’s well aware of what I do professionally. Over the years, she’s repeatedly asked me questions regarding her finances. Whenever we meet, I always remind her that I have no clients but only manage my own portfolio. She knows that we’re just two friends talking and that nothing I say should ever be construed as actual investment advice. What she gets is unbiased brutally honest guidance.
Despite having made this disclaimer clear from the start of our acquaintance, I have subtly peppered my little sermons to her with nuggets of fatherly advice about paying down her credit card debt and saving a certain percentage of her monthly earnings. Over time, my suggested savings amount has drifted lower from an initial suggestion of 10-15 percent all the way down to a current target of only 2-5 percent. It was clear to me early on that Barbara wasn’t grasping the importance of savings as she had little set aside over the years. But just recently, she proudly announced to me that she’s finally managed to pay off her credit card debt. Progress, I’d say, albeit a decade in the making.
In my experience, Barbara has many attributes that are stereotypic of the average investing refutenik. In our early association, my sincere offers to help her were genuine, although I fear those futile attempts may have been interpreted as condescending. It was similar, for example, to trying to talk to folks about obesity, video game addiction or drug habits. They don’t want to hear comments about their personal struggles— especially from someone who doesn’t share the same problem.
In my estimation, Barbara, who is now in her sixties, has been unwilling to confront the obvious — she’s edging closer to retirement with each passing year. For a decade, she’s floundered in accepting that unavoidable reality and she’s thereby refused to embrace the inevitability of the financial circumstances that will come with age. Despite my many offers to help her fill out brokerage applications and my suggestions that she start investing even minuscule amounts into Vanguard index funds, she has never accepted my assistance. Instead, Barbara has kept claiming that the everyday financial pressure points of life have deemed her unready as of yet. For over a decade, Barbara has been financially frozen into immovable inactivity despite having me pester her on a regular basis.
You may ask yourself why some politicians are advocating a new financial ecosystem where the Barbaras of the world should be held responsible for their own retirement. I submit two possible reasons:
- Yes, some small percentage of the citizenry will embrace this responsibility and build financial nest eggs that are far superior to any payout from Social Security.
- More likely, however, is the fact that politicians and bureaucrats have failed to properly manage the Social Security trust fund and want to just “pass the buck” — throwing financial accountability back at the very people they were supposed to protect.
My observation is that the majority of the citizenry will continue to be financial refuteniks and will keep on ignoring their personal financial realities. Sadly, I’ve become convinced that people like Barbara are not capable of developing the inner recalibration necessary to manage their own retirement. There’s an ocean of financial refuteniks out there, and the numbers are simply too enormous for us to allow Social Security to fade away into oblivion.
This is not a political statement on my part. It’s based on decades of my observation and experience from a sample size of over 5,000 students. Shame on those politicians who hide behind campaign jargon and economic models that don’t work. Equality amongst investors is a fallacy. Both politicians and financial refuteniks will give you many excuses for their irresponsible financial behavior, but the end result is the same — they crawl into a cave of financial denial.
Okay — that’s the reality as I see it, Now here’s my pitch for your help and participation. We all know financial refuteniks like Barbara. If there’s one in your life — perhaps a neighbor, a relative or a colleague — please extend a helping hand in the way of financial guidance and encouragement. Need some talking points? Here are a few:
- The first and highest leverage suggestion is convince your refutenik that credit card debit is the root of evil. If not managed, it’s a burden that can end up attaching a heavy ball-and-chain to one’s life.
- Recognize that even mini-steps such as regular monthly savings can lead to a rainbow. Putting aside even a small percentage of your earnings each month puts the magic stardust of compounding to work for you. This is especially true when you’re young. With various tax incentivized options and programs out there, it’s a no-brainer strategy. The objective is to break the corrosive mentality of “live for today — tomorrow will take care of itself.”
- Call it mentorship, being a positive role model, or simply financial cheerleading. It’s astonishing the difference you can make in an individual’s long term well-being just by encouraging them in small ways.
- If and when your refutenik-mentees accept a new vision and engage in these straightforward disciplines, providing them a rational investment framework could take them to a new level that they might never have imagined. (A framework such as The Ten Essential Stages of Stock Market Mastery)
If you read The Traders Journal on a regular basis, you have a social responsibility to try to educate financial refuteniks. The alternatives are not pretty. We know for a fact that early attention is always far more powerful than late intervention. This is true in all kinds of arenas. For example, research with kids has certainly shown that early intervention is important. When parents are actively engaged in childrearing and their kids attend preschool, those children get launched on an early path to success. The evidence shows that by third grade, children who lack this kind of parental attention will have already fallen far behind with little chance of catching up.
So there you have it. — and I didn’t even get on my high horse about passing the financial baton to the next generation. The bottom line is simply this: if left to their own devices, financial refuteniks may just breed the next generation of refuteniks. You should try to prevent that by helping your friends and neighbors in whatever way you can!
Thanks for your attention.
Trade well; trade with discipline!
- Gatis Roze, MBA, CMT
StockMarketMastery.com
|
| READ ONLINE → |
|
|
|
| The MEM Edge |
| Alert Yourself To Pullback Opportunities In Fast-Moving Stocks |
| by Mary Ellen McGonagle |
It’s been quite a star-spangled week for the markets, with the S&P 500 and Nasdaq hitting a new high 3 out of their 4 sessions. One sector showing particular strength has been Technology, which also reached a new high as many underlying stocks are posting significant returns. While this bullish action may have you eager to jump into some of these fast Tech movers, chasing stocks hitting a new high in price can be the surest way to frustration, as the inevitable pullback will have you wishing you waited.
By contrast, waiting for these pullbacks presents a much better opportunity. Today, I'll reveal not only how to uncover top stock candidates, but also precise entry points that you can be alerted to upon their pullback - all with StockCharts.com.
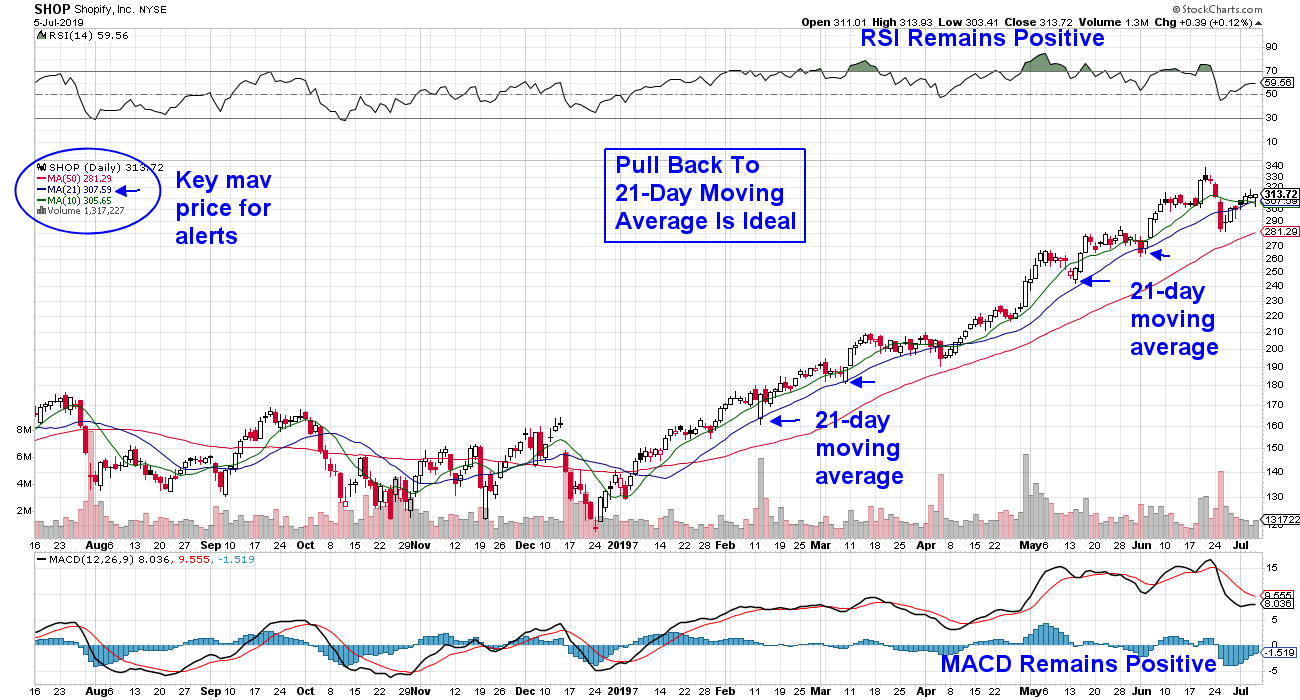
To begin, when a stock pulls back, you’ll want to pay attention to its simple moving average. While you can use either the shorter-term 10-day or the longer-term 21-day moving average, you’ll want to check the stock’s chart to uncover which one is the better indicator. This is because, as you’ll see, each stock has its own “personality” that determines which moving average it tends to obey. In the example below, we reviewed top performer Shopify (SHOP) and found that a pullback to its 21-day moving average has been the best entry point.
DAILY CHART OF SHOPIFY , INC.
Now let's move on to uncovering top stock candidates. The best way to do this is by using StockCharts's SCTR rankings. This technical ranking system is very powerful, as it identifies the most technically sound and, in most cases, faster moving stocks in a given area of the markets.
We'll begin by using the Sector Summary on the first page of StockCharts.com. From there, you can access the stocks in the sub-Industry groups. For instance, try accessing the Technology sector and clicking on an industry group. Then, sort those stocks by their SCTR ranking – highest to lowest.
Once you’ve uncovered several candidates and identified the key moving average that works best for a pullback, you’ll be ready to set up an alert. StockCharts's alert tool will notify you (via email) that your stock has hit your entry point. You can access the setup information for your alerts here.
As with all trading, you’ll want to use additional indicators to make sure that your stock is only pulling back, not entering a downtrend. The two indicators I’ve found very helpful are the relative strength indicator (RSI) and the Moving Average Convergence/Divergence (MACD).
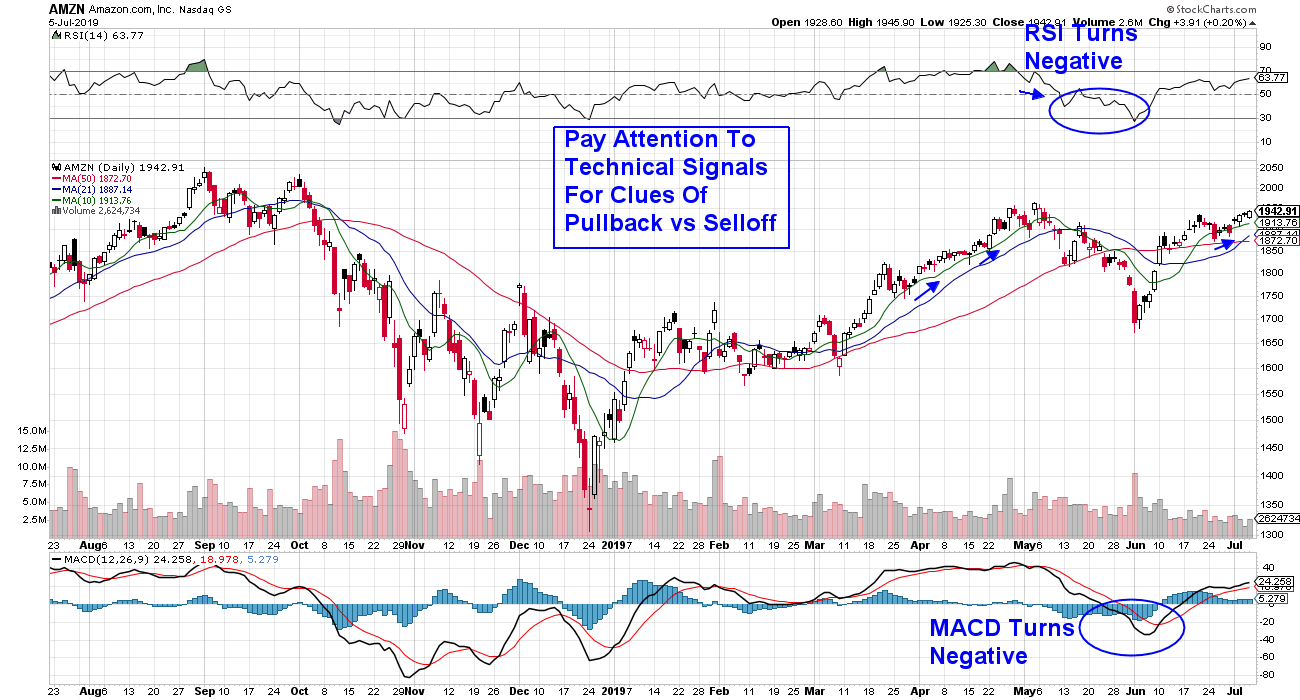
As you can see below, Amazon (AMZN) can normally be bought on a pullback to its 10-day simple moving average. However, in May, the dynamics shifted and the stock fell below both its 21- and 50-day moving averages, with both the RSI and the MACD turning negative at the same time. This was your signal that the near-term uptrend had reversed.
DAILY CHART OF AMAZON.COM, INC.
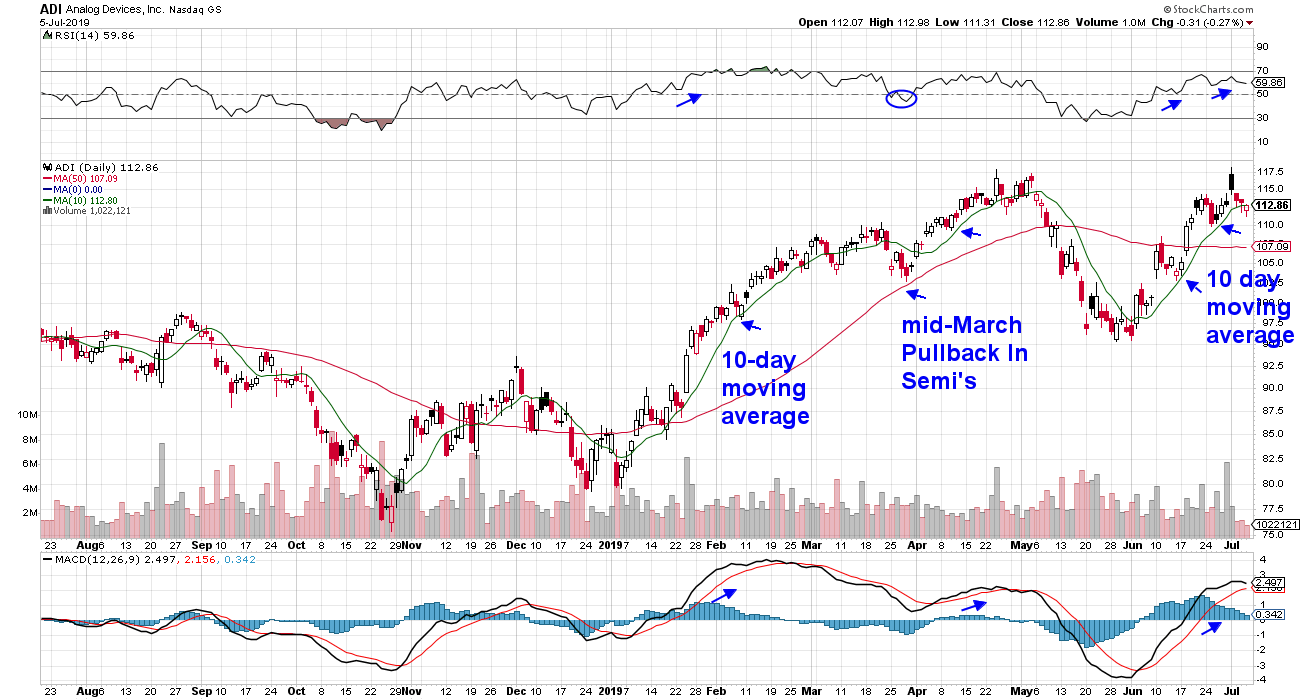
 There are other example of top-performing stocks that are at ideal buy points upon a pullback. Below is Semiconductor stock Analog Devices (ADI), which can be bought on a pullback to its 10-day simple moving average. By uncovering top candidates and saving them to your alerts, you can not only improve your returns, but you can also lower your frustration level. There are other example of top-performing stocks that are at ideal buy points upon a pullback. Below is Semiconductor stock Analog Devices (ADI), which can be bought on a pullback to its 10-day simple moving average. By uncovering top candidates and saving them to your alerts, you can not only improve your returns, but you can also lower your frustration level.
DAILY CHART OF ANALOG DEVICES (ADI)
Warmly,
Mary Ellen McGonagle,
MEM Investment Research
|
| READ ONLINE → |
|
|
|
| MORE ARTICLES → |
|


 The NYSE and Nasdaq are fine as exchanges, but their AD Lines do not tell the entire story when it comes to breadth. The major stock indexes, such as the S&P 500 and S&P Small-cap 600, contain stocks from both exchanges. As such, robust breadth indicators should include stocks from both exchanges and represent the market as a whole, not just one of the two exchanges. Today we will dive into the AD Lines for the NYSE and Nasdaq, and then chart index specific AD Lines, which I consider more robust.


 When you're a student pilot, your first couple of solo flights remain very close to your home airport. Basically, you get up in the air and do a couple laps around the landing pattern. This is meant to get you comfortable being in the plane by yourself, as well as help you gain confidence for the long solo flights.
 DAL was a leading stock, very strong relative to its airline peers. It was even outperforming the S&P 500 despite a poorly-performing airline group. Wall Street was pouring its money into DAL on a relative basis - we need to be aware of this!
 When you're a relative leader in one of the leading industries, Wall Street is placing a ton of confidence in a very solid upcoming earnings report. Expect a blowout.
 DHR showed some relative profit-taking earlier this year prior to a massive gap higher. I'm expecting something similar here. DHR has been an exceptional medical equipment company for a long time and Wall Street seems to be predicting another big quarter. I agree.
 Now, before you talk about how the technical outlook has changed with the recent move back above key moving averages and the PPO turning positive, refer to those red circles back in February and April. The same technical improvements occurred just before the bottom dropped out. I'd be very careful with a stock like ADS - at least until we see improving fundamentals and some lasting relative strength.
 This is a true story about someone whom I’ll refer to as an investing “refutenik”. But first, a bit of background. The long-term financial viability of Social Security is questionable, yet some politicians like to toss around the idea of delegating more accountability to John Q. Public for taking responsibility for his or her own retirement well-being, In expecting people to embrace both regimented savings and disciplined investing, I’m reminded of a famous quote about democracy that I’ll just paraphrase: “The best argument against encouraging the citizenry to be responsible for financing their own retirement is a five-minute conversation with the average American.”
 There are other example of top-performing stocks that are at ideal buy points upon a pullback. Below is Semiconductor stock Analog Devices (ADI), which can be bought on a pullback to its 10-day simple moving average. By uncovering top candidates and saving them to your alerts, you can not only improve your returns, but you can also lower your frustration level.


