This week's edition of The ChartWatchers Newsletter has arrived, featuring exclusive market analysis and technical commentary from our team of world-renowned, expert contributing analysts.
There are tools that we use, and then there are tools we use every single day.
When it comes to the latter, I'd say the chart annotation tools have to be right up there at the top of the list. Whether you're drawing trendlines, taking notes, finding support and resistance levels, or studying something more complex like Fibonacci retracement levels, the annotation capabilites on StockCharts provide crucial functionality that helps each and every one of us take our charting to the next level.
So this week on "StockCharts In Focus", we're touring you through the chart annotation tools in both SharpCharts and ACP, our Advanced Charting Platform.
Along the way, you'll see some extremely helpful tips and tricks that will enhance your drawings and streamline your annotating experience. With these shortcuts and hotkeys at your disposal, you'll be marking up those charting faster and more efficiently than ever before.
Click the thumbnail below to watch now!
Chart on, my friends.
Grayson Roze
VP of Operations, StockCharts.com
Author, Trading For Dummies
Author, Tensile Trading
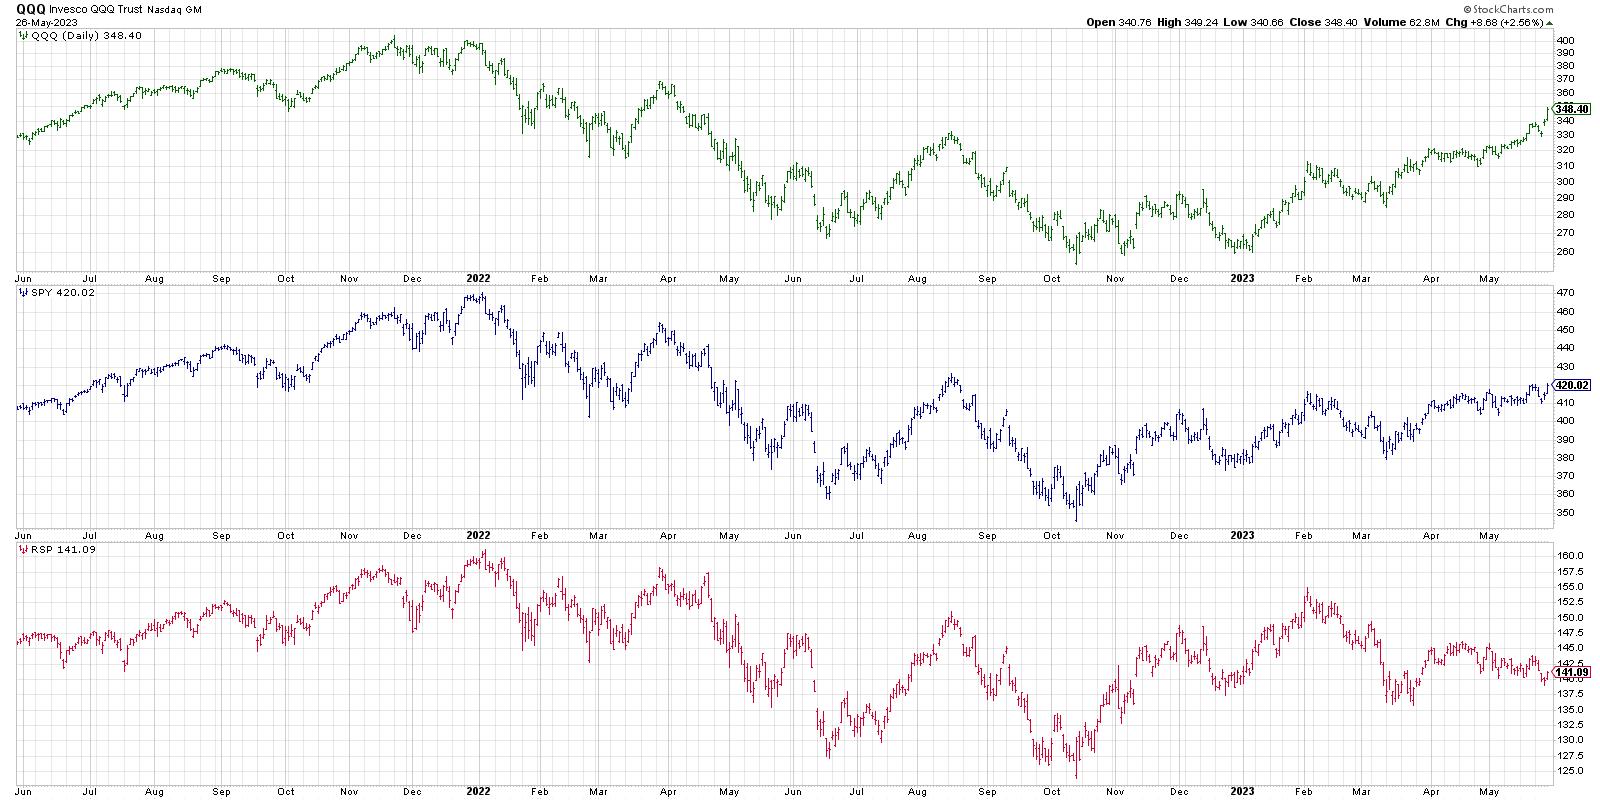
TALE OF TWO MARKETS... Previous messages have pointed out the growing gap between rising technology stocks and the rest of the market. That gap widened even further this week. Technology was once again the week's strongest sector thanks to surging chip stocks...
My research suggests that profit targets improve results for trend-momentum strategies that trade ETFs. Note that performance improvements may differ for other strategies. This article will first show a trend-momentum setup on the chart...
May is Asian American and Pacific Islander Heritage Month. In recognition of the AAPI community, StockCharts spoke with a few individuals in the financial community about how their experiences, challenges, and heritage helped shape their careers in finance...
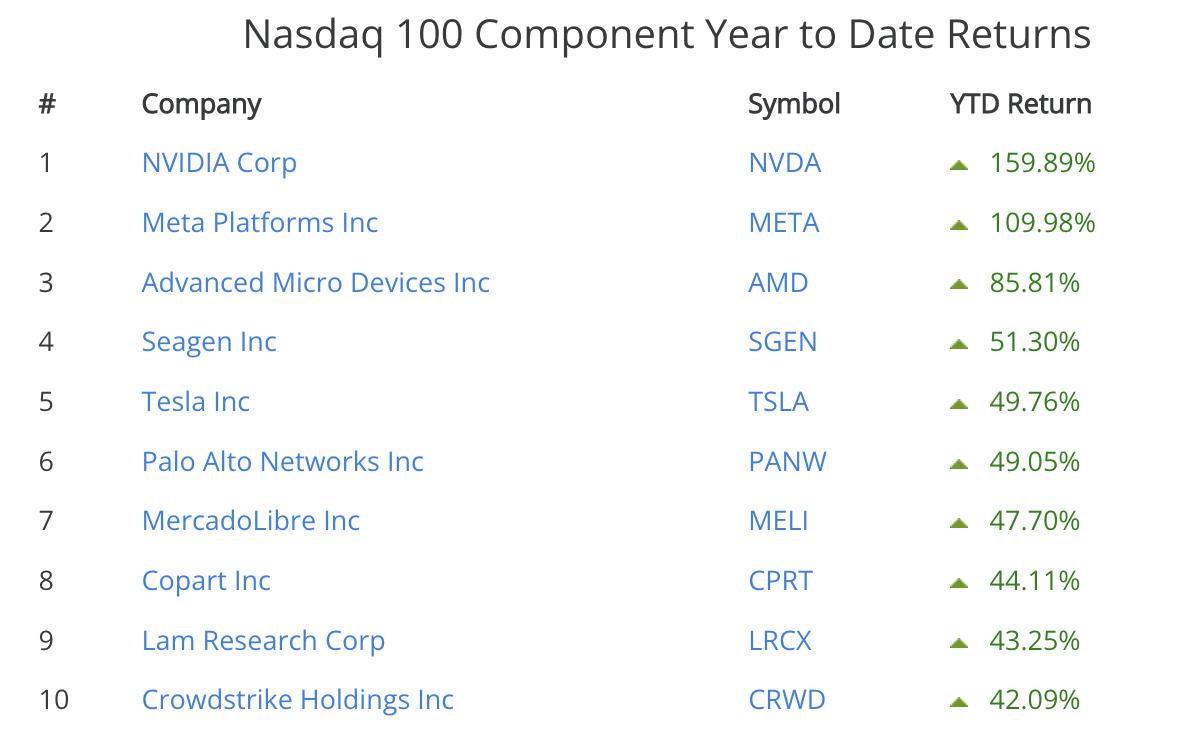
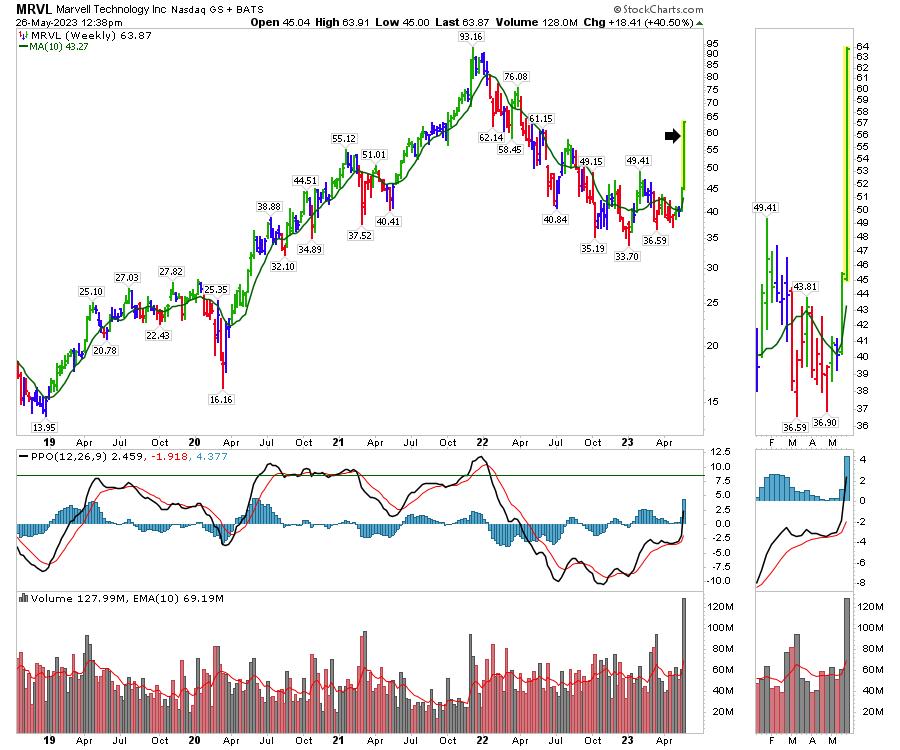
When rocket green flares fly across the space, it is so hard to chase in terms of risk management. Friday's example of Marvell (MRVL) moving 40% in a week after Nvidia (NVDA) lit the fuse one day earlier is amazing to watch. Friday saw the Nasdaq 100 soar by more than 2%...
A couple of weeks ago (early May), the price of spot gold reached a high of $2085 an ounce, nearly challenging its all-time high of around $2089 last reached in 2020. Since then, gold's had a rough ride...
As a StockCharts Member, you unlock all of our most powerful tools and features, including saved charts and settings, custom scans, technical alerts and much more. Discover all that StockCharts can do with our free 1-month trial and start charting like a true market pro.