|
There was a lot of up-and-down price action in the stock market this week. By the end, though, the Dow ($INDU), S&P 500 ($SPX), and Nasdaq ($COMPQ) rose toward the tail end of Friday’s trading and ultimately closed higher. The Nasdaq rose the highest, closing 0.52% higher.
There was a slight rotation into the Communication Services, Consumer Discretionary, and Technology sectors, which helped boost the indexes. But one day’s action, especially in the last 30 minutes of the trading week, shouldn’t get you too excited. The year-to-date picture of the S&P 500 sector performance paints a different picture.
This PerfChart of the S&P Sector ETFs below shows the year-to-date sector performance relative to the S&P 500.
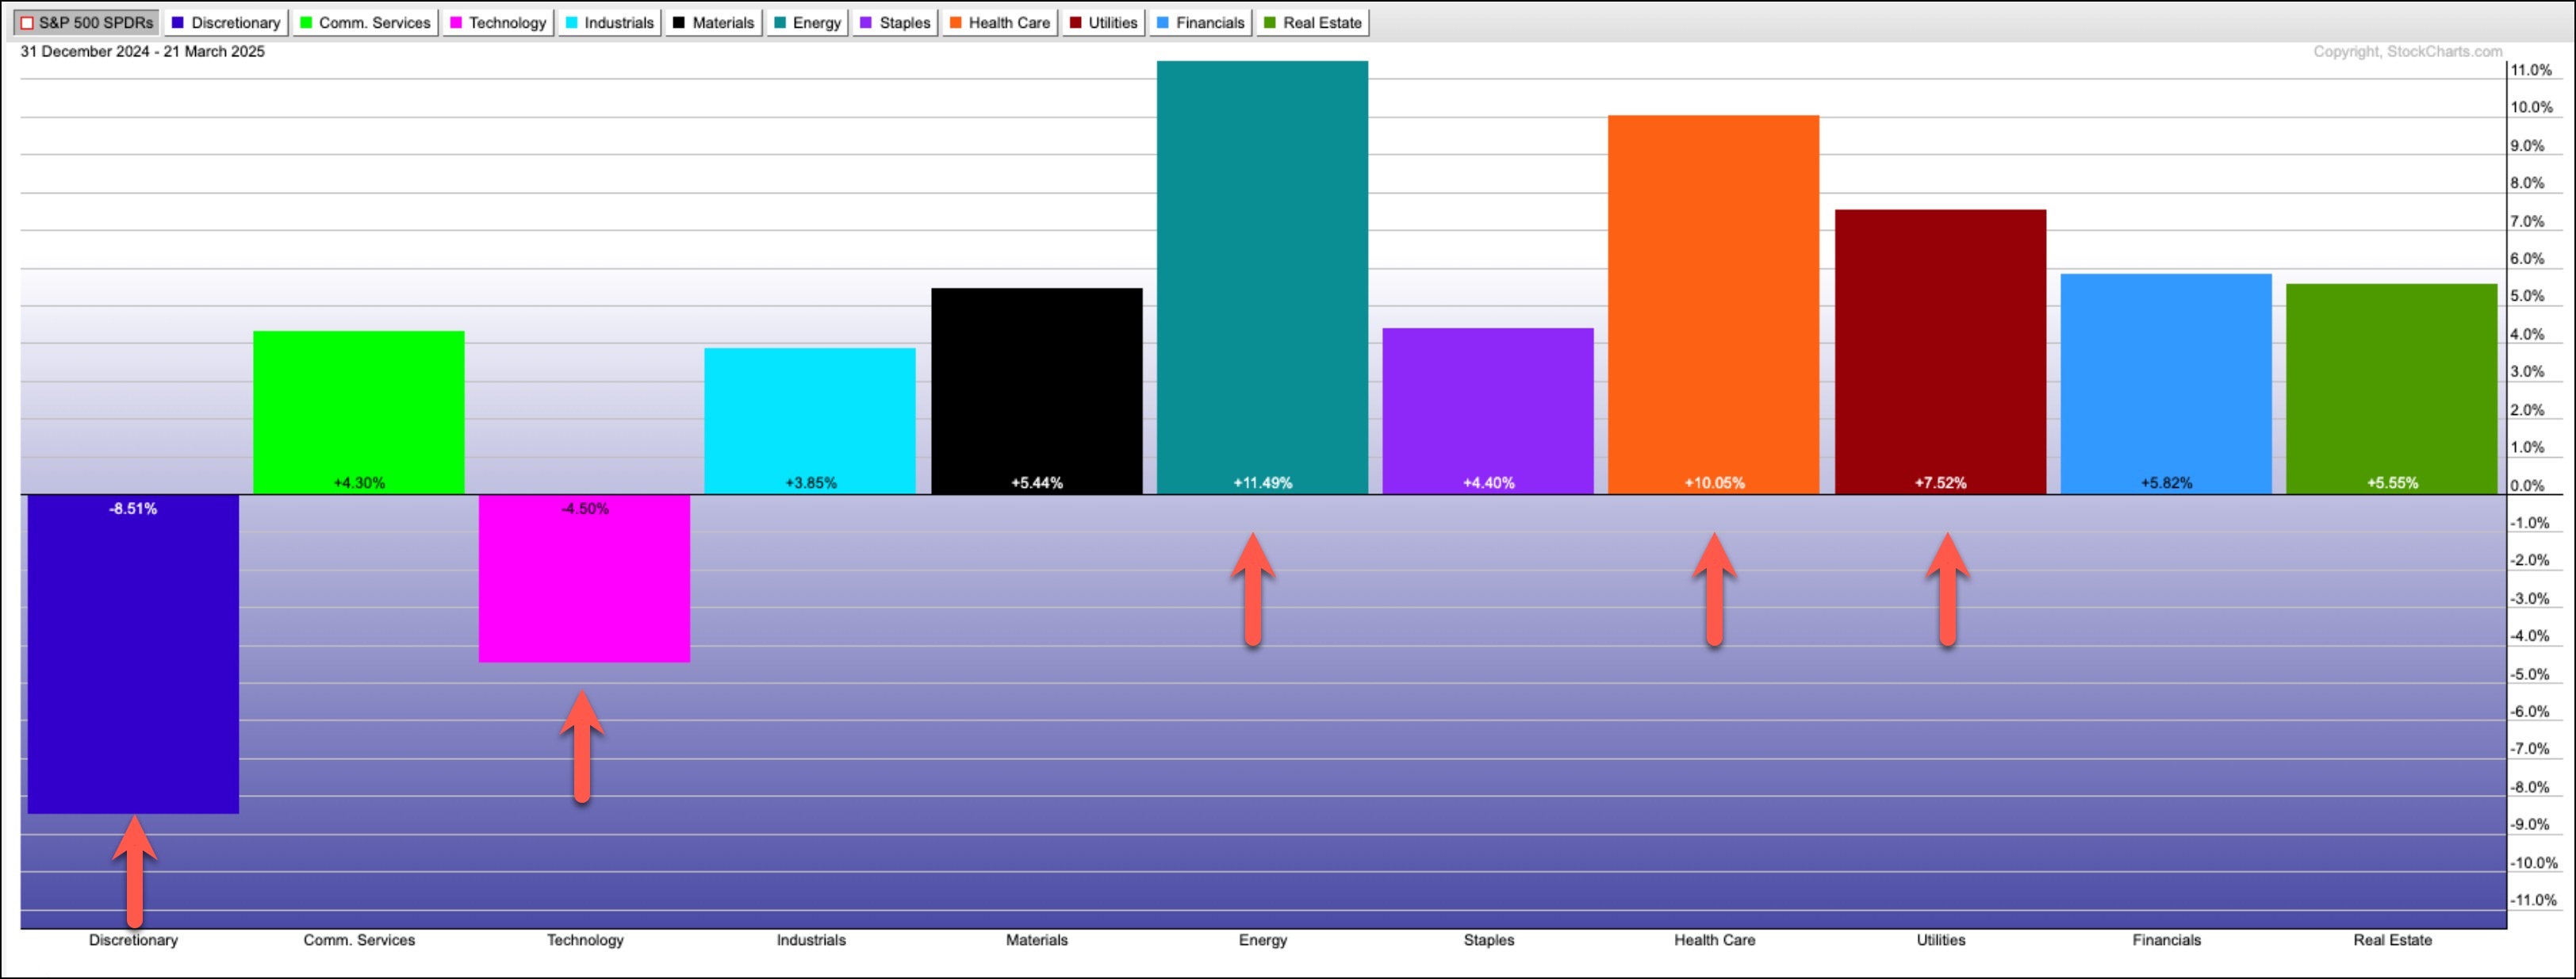
Note that Consumer Discretionary is the laggard, underperforming the S&P 500 by -8.51%. Technology is next, underperforming the S&P 500 by -4.50%. The leading sector performers are Energy (+11.49%), Health Care (+10.05%), and Utilities (+7.52%). This suggests that investors are rotating into defensive stocks, or those that are less risky.
This is a significant change from what investors were doing in 2024. Nobody knows how long investors will continue to rotate into defensive sectors, but it’s something that astute investors should monitor. A short-term change in investor risk appetite doesn’t necessarily mean everyone should move all their assets into the outperforming sectors, but, if the rotation continues, it could mean it’s time to reevaluate your portfolio.
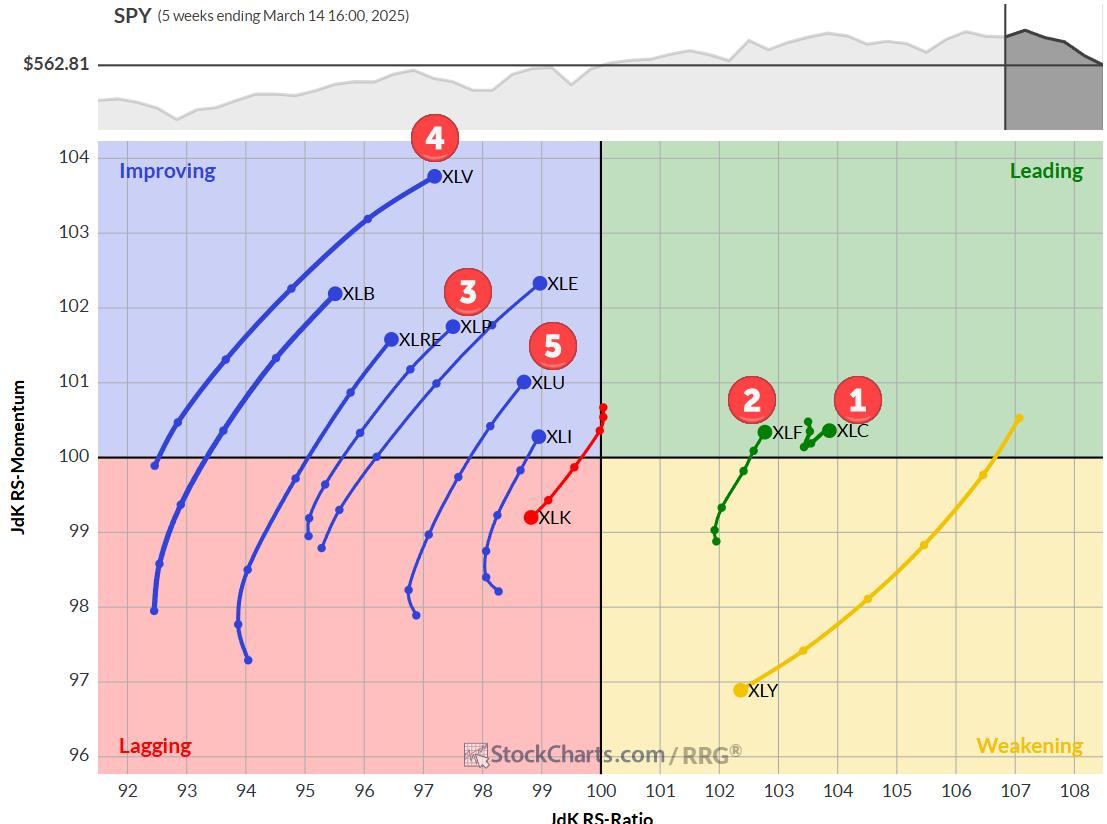
The StockCharts Sector Summary Dashboard panel gives you a bird’s eye view of the leading and lagging sectors. From here, you can dive deeper into the industry groups within sectors, and from there into the stocks within industry groups. Give it a try. In addition to PerfCharts, you can view sector performance via Sector RRG Charts or Sector CandleGlance. Find what works best for you and monitor it regularly.
|