| Hello, Fellow ChartWatchers! |
A strong finish to June, and even stronger charting tools to match!
So far, this year, the stock market has taken investors on a wild ride. But as we head into the final trading day of June, though, the major indexes have ended on a high note. The S&P 500 ($SPX) and Nasdaq Composite ($COMPQ) closed at record highs, and the Dow Industrials ($INDU) also rose by 1% Friday, although it’s still working its way toward its record high.
With nearly half the year behind us, it’s worth reflecting on the market’s price action so far. We’ve gone through some relatively volatile periods, especially when it comes to sector rotations.
Our year-to-date PerfChart of the different sectors, relative to the S&P 500, illustrates just how much of a ride it has been. Early in the year, sectors were all over the map. Then, in mid-February, we saw nine of the eleven S&P sectors outperform the S&P 500, while former leaders — Consumer Discretionary and Technology — took a back seat. Click on the chart below and select the line chart icon on the bottom left.
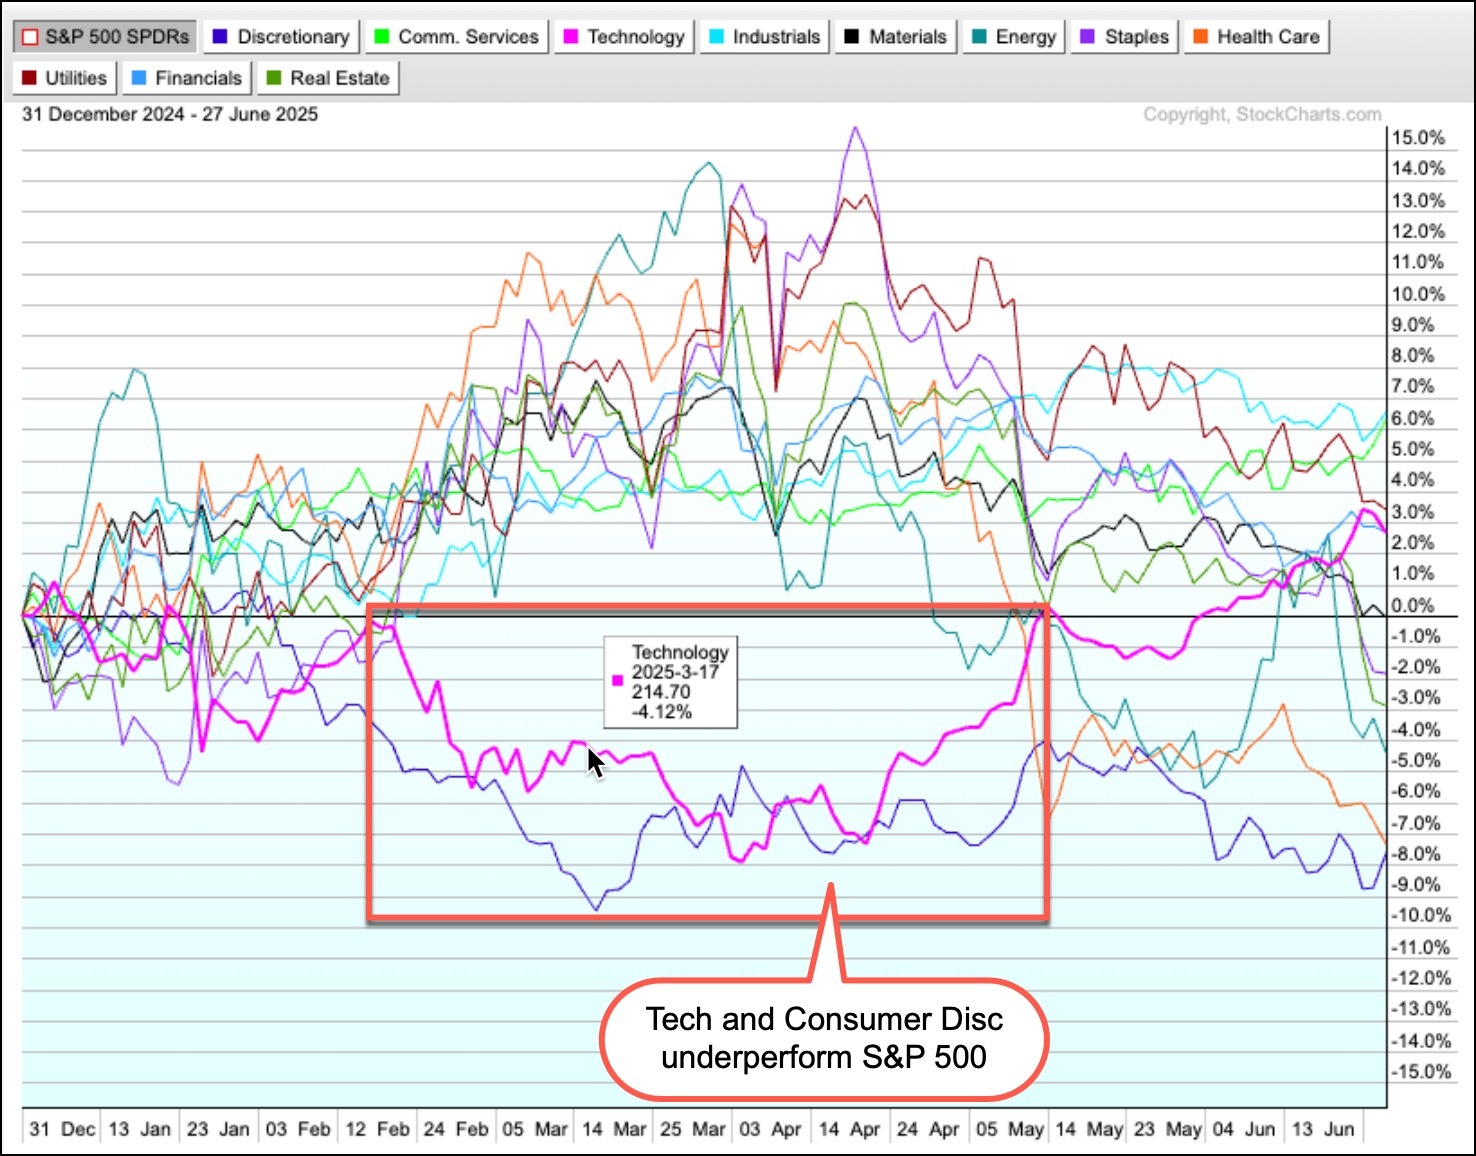 Fast forward to June, and the Technology sector has moved into positive territory. Heavy-weighted tech stocks led the broader market higher in 2024; will they do it again? This is something to monitor as we move into the second half of the year. Fast forward to June, and the Technology sector has moved into positive territory. Heavy-weighted tech stocks led the broader market higher in 2024; will they do it again? This is something to monitor as we move into the second half of the year.
New tools to help you monitor market trends
Our Market Summary page has always been a favorite among StockCharts users, but now, it’s even better. Here are a few of the new features:
- Additional indexes and chart links. These include S&P earnings charts, S&P 1500 breadth data, micro-cap vs. large-cap performance ratio, and the index-only put/call ratio.
- Mini charts in the Sector panel. These give you a visual snapshot of the ETFs we use as proxies for the 11 S&P sectors. What’s even better is that you can customize the time frame of the charts. To do so, simply head to the top of the page and select your desired timeframe from the dropdown menu. This will update the mini-charts and the data columns in the panels.
- A Credit Spreads tab in the Bonds panel. This will help to see if credit spreads are widening or narrowing.
- A new Economic Indexes panel. This includes a collection of key U.S. data points like GDP, inflation, housing numbers, and industrial production.
To get a full rundown and see how these features can sharpen your technical analysis, don’t miss the walkthrough from Grayson Roze, our Chief Strategist. In just 30 minutes, he’ll walk you through all the new features, and you’ll gain some important insights into how he uses these features in his daily analysis.
You can watch the video here. It’s short, insightful, and well worth your time even if you’ve got movie night planned for F1: The Movie. |
| Enjoy your weekend! |
|
|
|
| THIS WEEK'S ARTICLES |
|
|
|
|
|
|
|
|
| Don't Ignore This Chart! |
| SMCI Stock Surges: How to Invest Wisely Now |
| by Jayanthi Gopalakrishnan |
| Over a month ago, Super Micro Computer, Inc. (SMCI) appeared on our StockCharts Technical Rank (SCTR) Top 10 list. SCTRs are an exclusive StockCharts tool that can help you quickly find stocks showing strong technical strength relative to other stocks in a similar category... |
|
|
|
|
|
|
|
|
|
| A View From the Floor |
| 3 Stock Setups for the Second Half of 2025 |
| by Jay Woods |
| As we head into the second half of 2025, here are three stocks that present strong technical setups with favorable risk/reward profiles. One is the largest market cap stock we're familiar with, which bodes well for the market in general... |
|
|
|
|
|
| MORE ARTICLES → |
|