| THIS WEEK'S ARTICLES |
| Martin Pring's Market Roundup |
| MEMBERS ONLY |
| The Dollar Index Just Gave a Major Sell Signal — Does That Mean It's About to Implode? |
| by Martin Pring |
|
Last month, the Dollar Index triggered a number of sell signals confirming that it is in a bear market. Chart 1, for instance, shows that the red up trendline emanating in 2011 has been decisively ruptured, thereby pushing the Index further below its moving average...
|
| READ ONLINE → |
|
|
|
| ChartWatchers |
| Missed Disney's Rally? Grab This Defined-Risk Put Spread for a Second Chance |
| by Jayanthi Gopalakrishnan |
 Stocks keep notching record highs. If you're like most investors, you're probably wondering, "Should I really chase these prices or sit tight and wait for a pullback?" Stocks keep notching record highs. If you're like most investors, you're probably wondering, "Should I really chase these prices or sit tight and wait for a pullback?"
Instead of overthinking and ending up in Analysis-Paralysis land, however, it may be worth exploring other avenues — and maybe even something you've never thought of.
Enter bearish counter-trend options strategies. Yup, it sounds crazy, especially when the S&P 500 ($SPX) and Nasdaq Composite ($COMPQ) closed at fresh highs. But here's the reality: a well-planned put strategy has the potential to generate some revenue while you wait for the market to slow down or pull back. I got the idea after watching a recent video that dives into these strategies (worth watching if you haven't).
Finding an Optimal Options Strategy
If you click the OptionsPlay Strategy Center tab on your StockCharts Dashboard (OptionsPlay Add-On for StockCharts required), choose the Bearish Counter Trend or Bullish Counter Trend categories (depending on whether the market is bullish or bearish), and then select the Bear Put Spread strategy, you'll see all the stocks that meet the criteria. Since stocks are in a bullish trajectory, I decided to look at stocks in the Bearish Counter Trend list. I also chose the 45-day timeframe, a balanced risk profile, and $2,500 max risk. I sorted the list based on IV rank. Walt Disney Co. (DIS) made it to the top of the list.
A couple of points to consider:

- A risk/reward ratio of 0.6 to 1
- Disney's earnings date of August 6, which falls before the spread expires.
However, looking through the other charts on the list, DIS appeared to be the most likely to pull back in the near term.
Here's where the beauty of options comes into play. They're extremely flexible, and you can tweak the strategies to give you a risk/reward that's more desirable.
With that in mind, let's dive into Disney's stock chart and consider how low the stock could go.
Disney's Daily Chart
Looking at the daily chart of DIS, the stock price has pulled back a bit, and momentum, although relatively high as indicated by the relative strength index (RSI) and percentage price oscillator (PPO), is showing signs of slowing down. If momentum continues to weaken, DIS could move lower and fall to around the $120 level (dashed blue horizontal line).

FIGURE 1. DAILY CHART OF DISNEY STOCK. DIS has been rising after its early May gap up. It's now pulling back, and Disney's stock price closed today at $122.98.Chart source: StockCharts.com. For educational purposes.
The Put Spread Can Bring a Little Magic
If you click the Options tab below the chart, you'll see three strategies you could apply. Since I have a bearish bias, I clicked the Bearish button. The three optimized strategies that came up:
- Sell 100 shares of DIS.
- Buy one DIS put.
- Buy a put vertical. The put vertical has the highest OptionsPlay score and is the one that aligns with the bearish counter-trend strategy.
Looking at the risk curve for the put spread — buying 1 Aug 15 125 put and selling 1 Aug 15 110 put (see below) — you're risking $471 for a potential reward of $1029. This is slightly better than a 0.6 to 1 risk/reward ratio. The breakeven level is $120.29, which aligns with the support level on the price chart. At least there's a high probability of breaking even, although you want to do better than that. DIS could fall below the $120 level. I would consider placing this trade.

FIGURE 2: RISK CURVES FOR THREE OPTIMAL STRATEGIES FOR TRADING DIS STOCK. The put vertical spread has the best score, defined-risk, and an attractive payoff.Chart source: StockCharts.com. For educational purposes.
Final Thoughts
Options are dynamic, and if you decide to put on the trade, monitor your open positions regularly. With options, it's not just about price. Time decay and volatility can change the premiums. If these variables change significantly, consider adjusting your trade.
Disclaimer: This blog is for educational purposes only and should not be construed as financial advice. The ideas and strategies should never be used without first assessing your own personal and financial situation, or without consulting a financial professional.
|
| READ ONLINE → |
|
|
|
| RRG Charts |
| The Best Five Sectors, #25 |
| by Julius de Kempenaer |
A Greek Odyssey
First of all, I apologize for any potential delays or inconsistencies this week. I'm currently writing this from a hotel room in Greece, surrounded by what I can only describe as the usual Greek chaos. Our flight back home was first delayed, then canceled, then rescheduled and delayed again. So instead of being back at my desk as planned, I'm getting back into the trenches from a small Greek town. But the markets wait for no one, so here we are!
Market Sector Shifts: Tech Takes the Lead
The changes in our top five aren't massive, but they're certainly worth noting. Technology has muscled its way back to the #1 spot, nudging Industrials down to second. Communication Services and Utilities are holding steady at positions #3 and #4 respectively. The most interesting move, imho, is Financials re-entering the top five at #5, up from #7 last week.
Real estate remains just outside at #6, while Consumer Staples has dropped out of the top five, landing at #7. Materials and Energy are still bringing up the rear at #8 and #9. In a bit of musical chairs, Consumer Discretionary and Health Care have swapped places -- Discretionary now at #10 and Health Care down to #11.
- (2) Technology - (XLK)*
- (1) Industrials - (XLI)*
- (3) Communication Services - (XLC)
- (4) Utilities - (XLU)
- (7) Financials - (XLF)*
- (6) Real-Estate - (XLRE)
- (5) Consumer Staples - (XLP)*
- (8) Materials - (XLB)
- (9) Energy - (XLE)
- (11) Consumer Discretionary - (XLY)*
- (10) Healthcare - (XLV)*
Weekly RRG
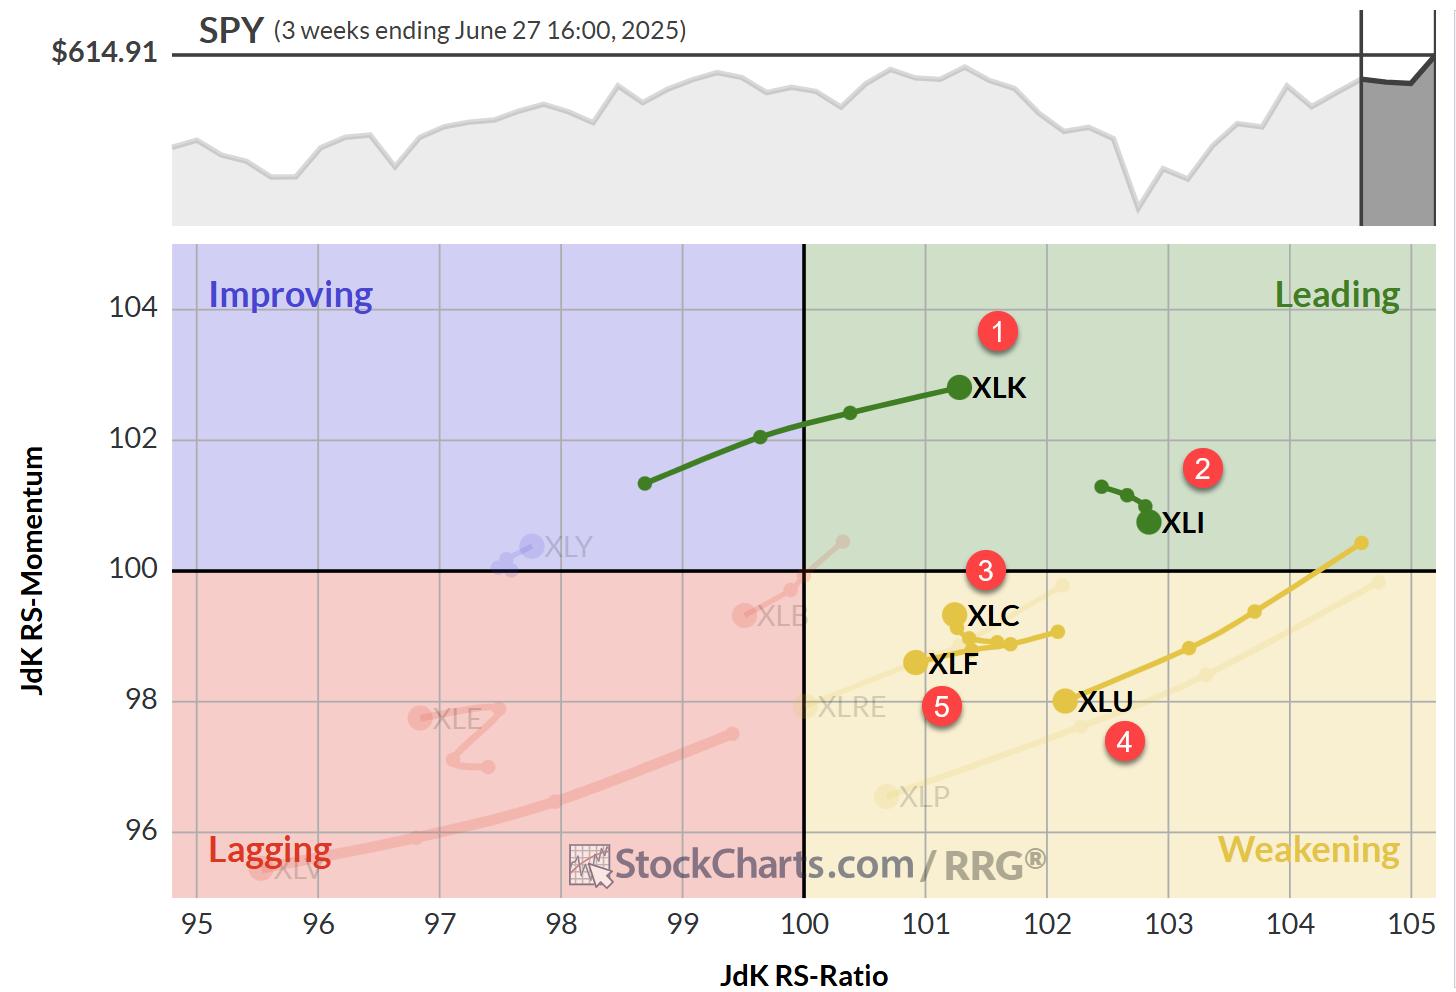
The weekly Relative Rotation Graph (RRG) paints a clear picture of Technology's strength as it powers further into the leading quadrant. Industrials is still in the lead, but has started to lose some relative momentum -- though it's maintaining the highest RS-ratio reading. Communication Services is showing a clear upward rotation, while Financials and Utilities are inside the weakening quadrant with negative headings (but still above the 100 level, keeping them in the top five).
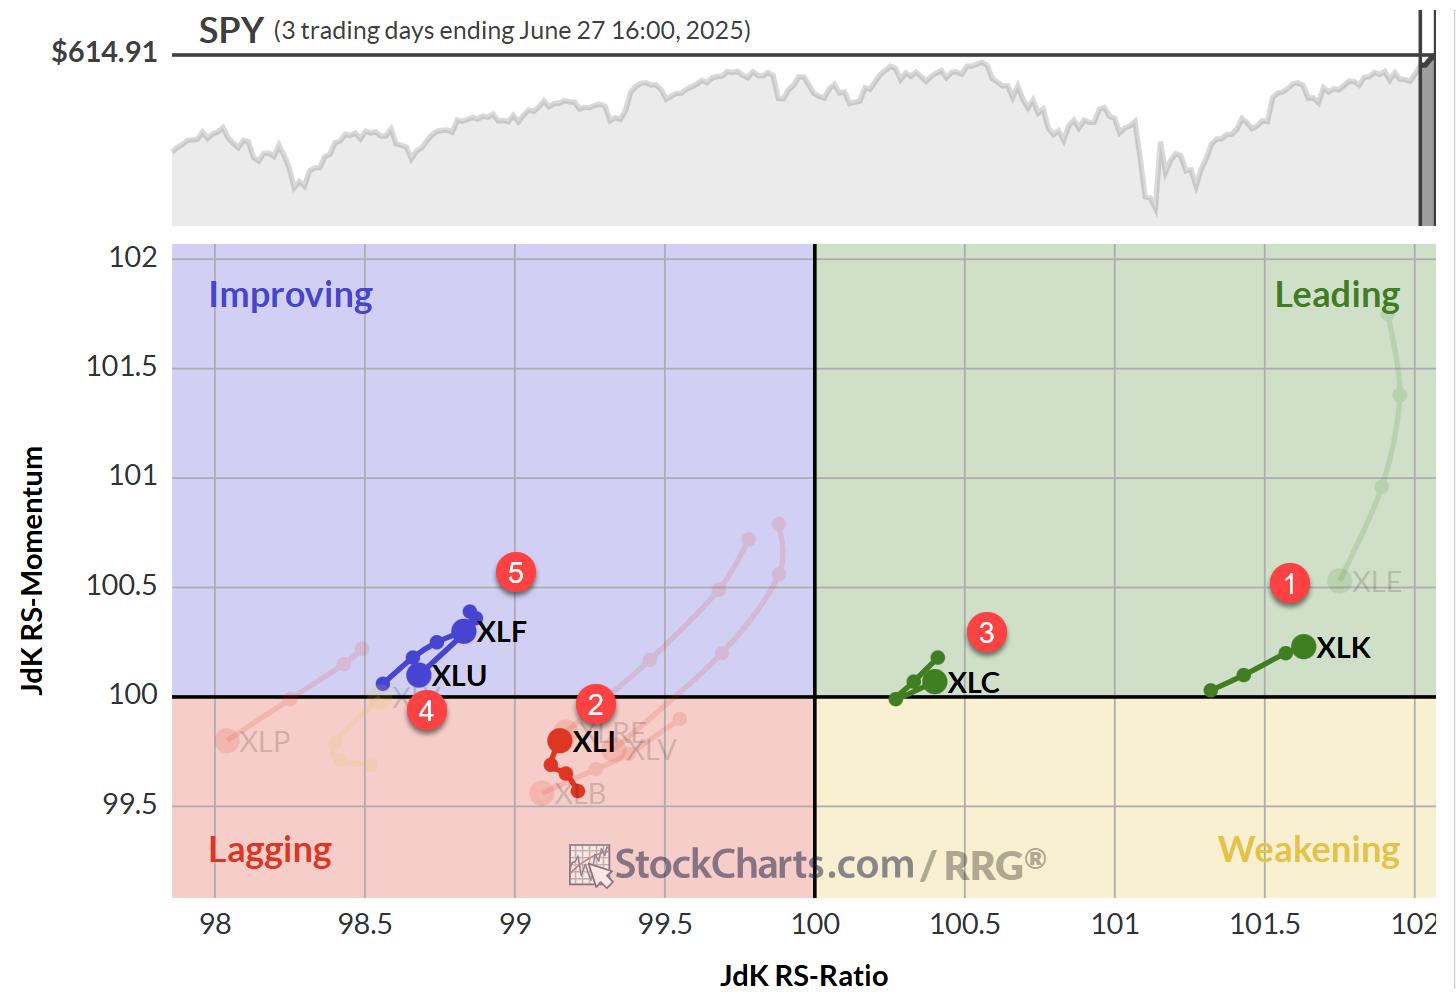
Daily RRG
- Technology and Communication Services flexing their muscles in the leading quadrant
- Industrials inside lagging, but turning back up
- Financials in improving on a positive heading
- Utilities rotating back down at a negative heading, close to crossing into lagging
The sector at risk here is clearly Utilities -- at least for now.
Technology
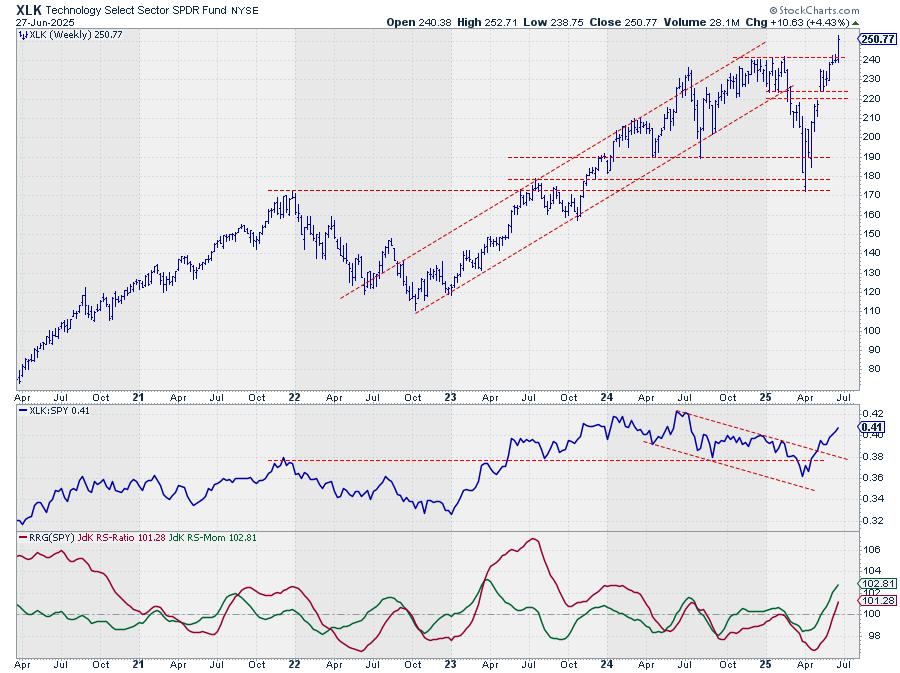
The Technology sector chart is showing a very clear breakout above the resistance area around 240. It's a decisive move, and that old resistance should now act as support. This breakout is mirrored in the relative strength line, which has continued its upward trajectory after breaking out of the falling channel.
Industrials
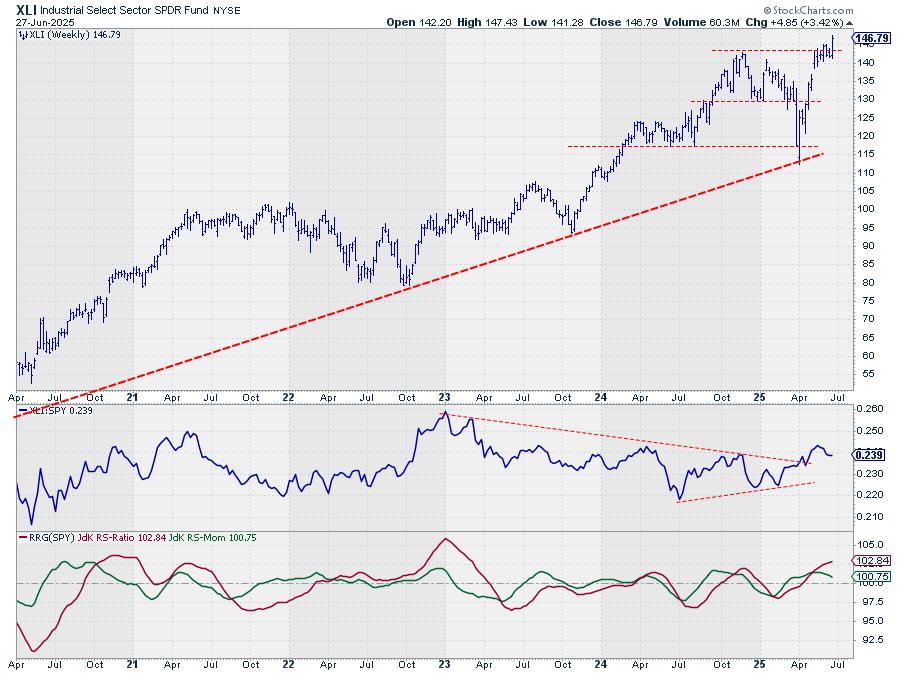
Industrials are also flexing their muscles, clearing overhead resistance with a nice breakout. The relative strength line, already out of its consolidation pattern, appears to be gaining momentum again. This is starting to drag the RS ratio line higher.
Communication Services
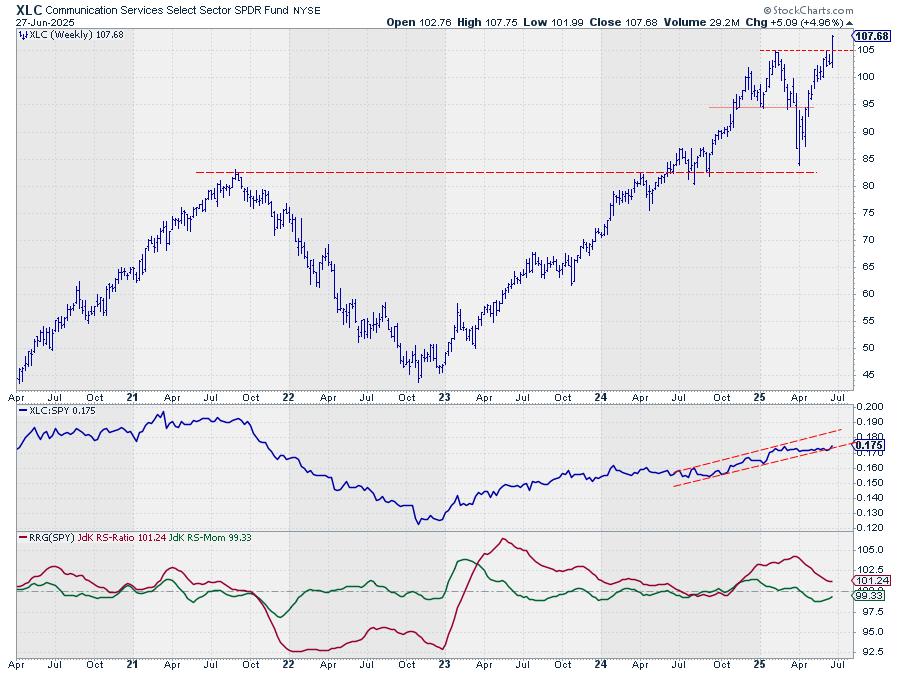
Communication Services is showing a clear upward break over the 105 resistance area. Just like Tech and Industrials, that old resistance is now expected to act as support. The price strength is finally reflected in the relative strength line, which has started to move up against the rising support line. This is causing the RS momentum line to pull up, almost crossing back over the 100 level, which should, in turn, push Communication Services back into the leading quadrant on the weekly RRG.
Utilities
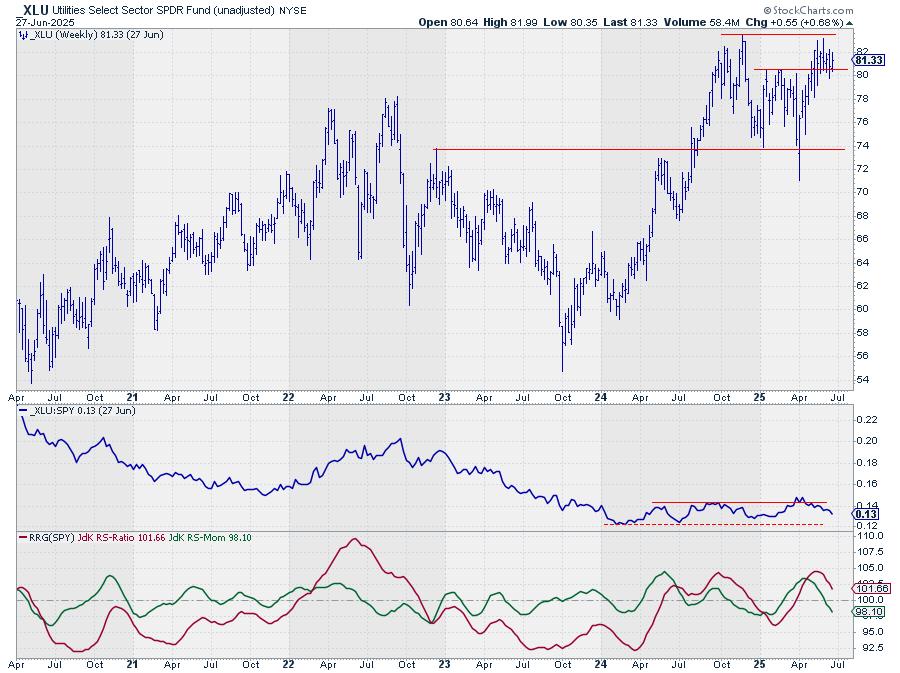
Utilities, one of the defensive sectors in this cyclical power play, has remained static within its range. But in this market, standing still means losing relative strength. The utility sector is becoming increasingly at risk, with its relative strength chart returning to the trading range and heading towards the lower boundary. This is dragging the RRG lines lower.
Financials
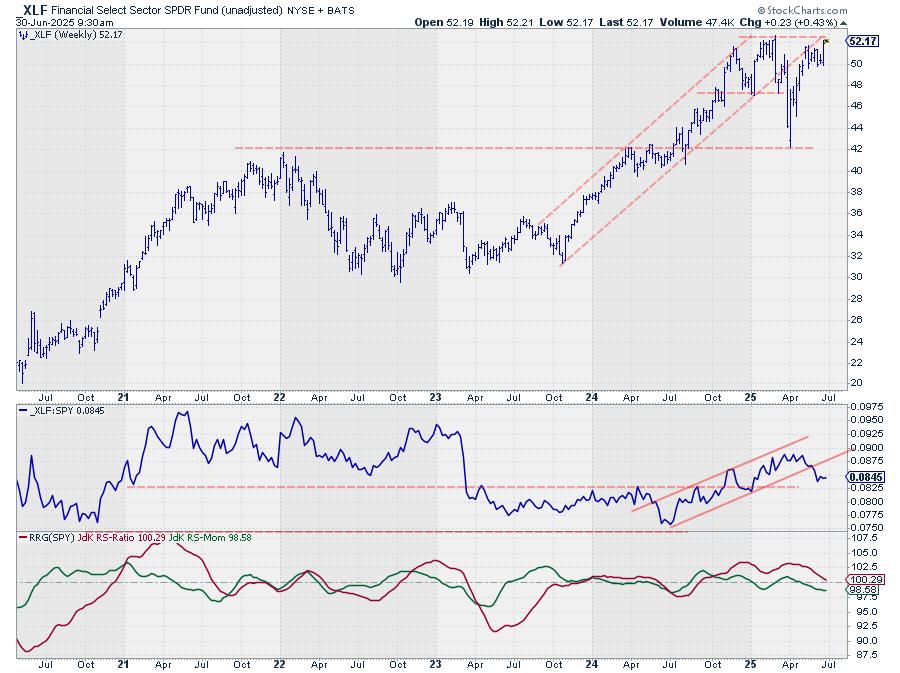
Financials, our new entrant in the top five, is still grappling with the old rising support line and overhead resistance level. However, last week's price action seems to have broken the sector out of a small consolidation pattern. If Financials can now take out the overhead resistance just above 52, it'll be a powerful sign for this sector.
Portfolio Performance
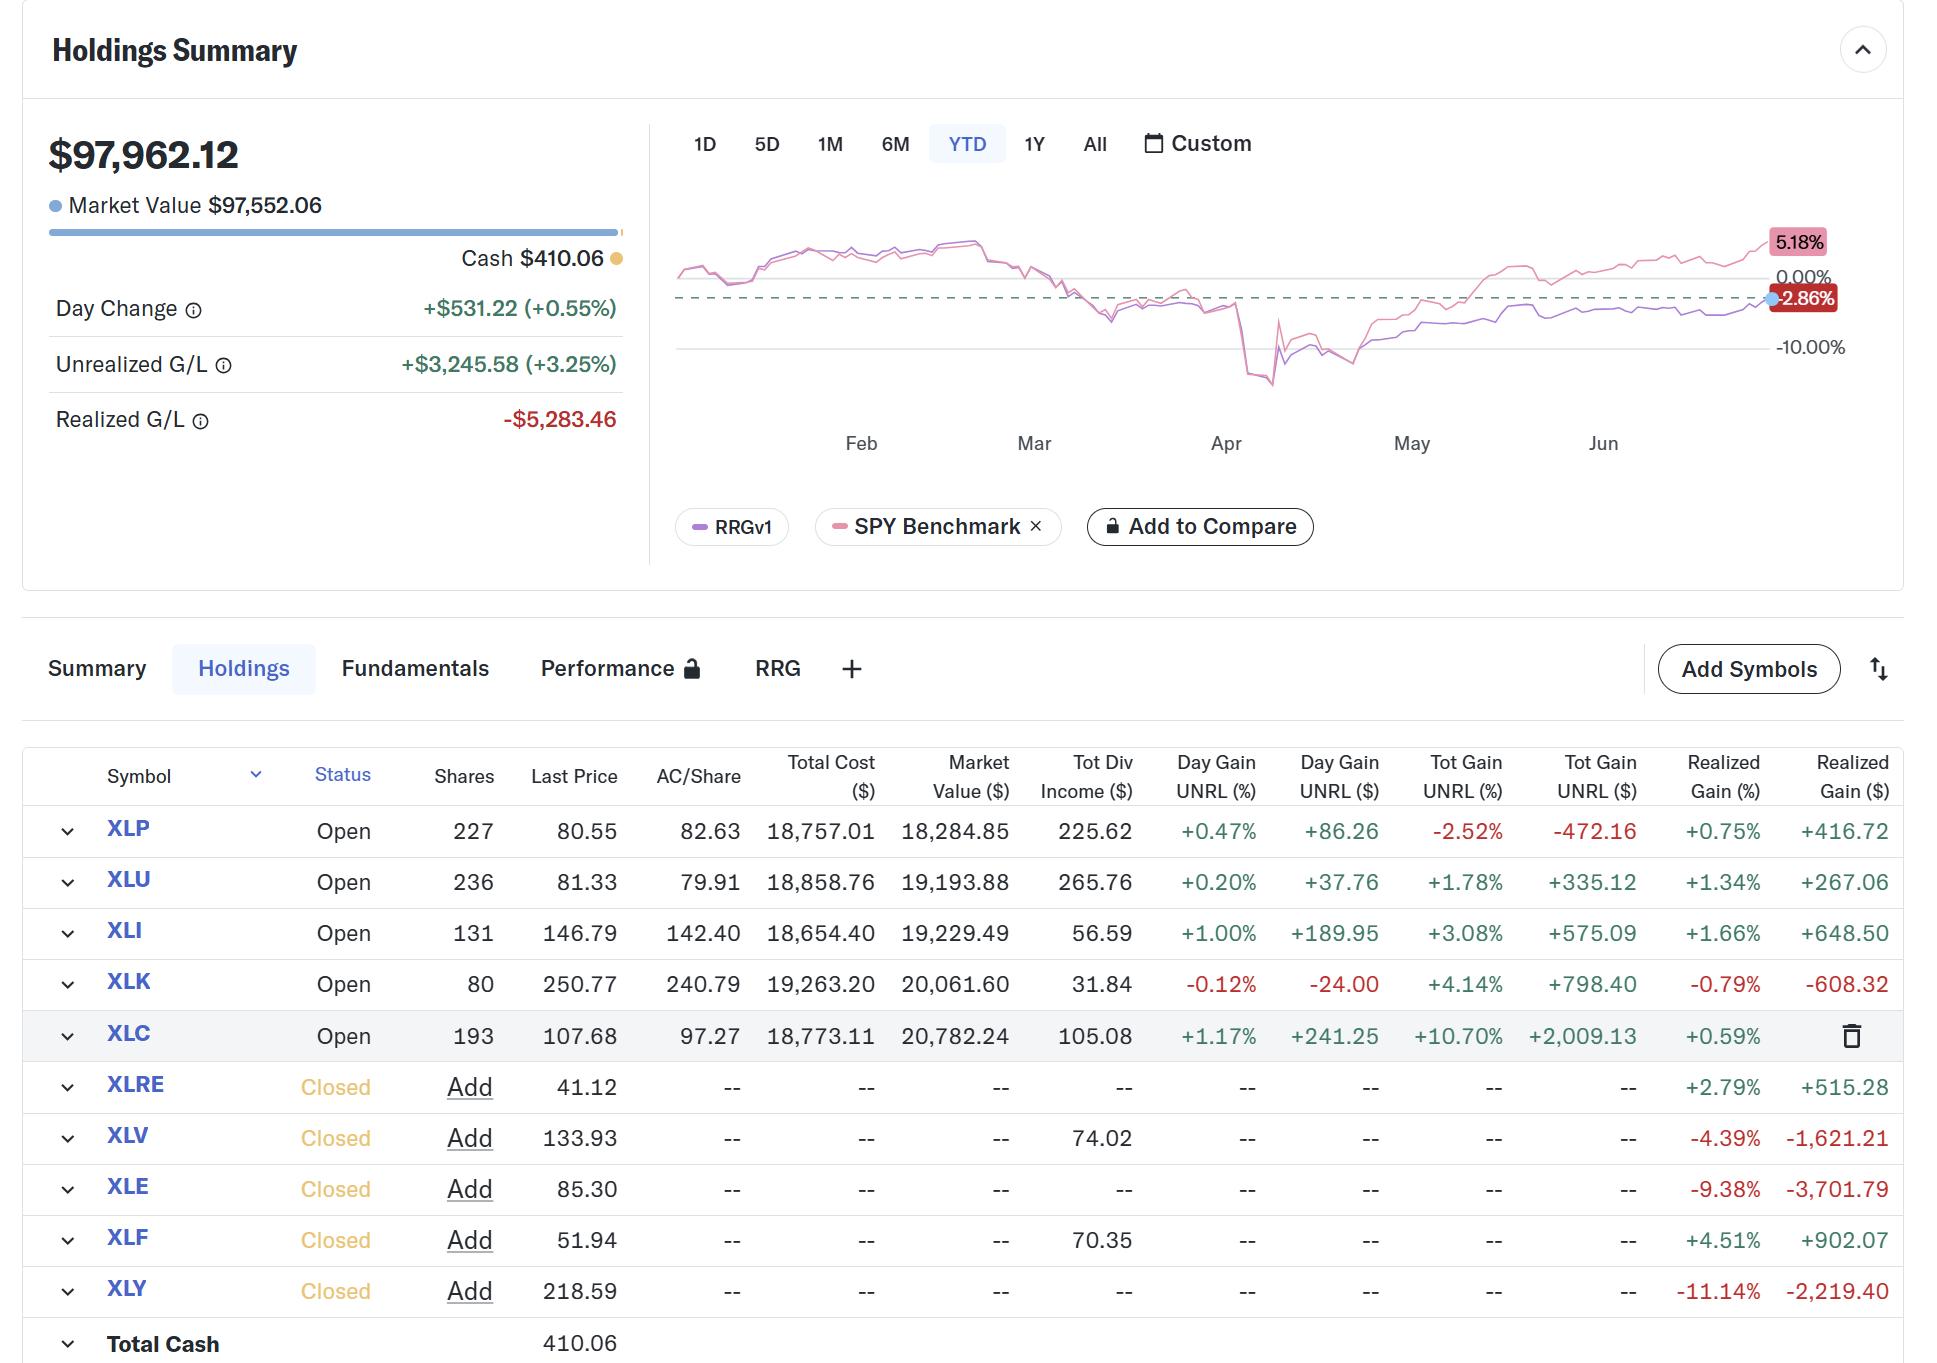
From a portfolio performance perspective, we're getting hurt by the strength of the Technology sector. It's in the portfolio, but not enough to keep up with the S&P 500's performance. We're still underperforming by around 8%.
To turn this situation around, we need sustained moves higher by Technology, Communication Services, and potentially Financials. If Consumer Discretionary could join the party at some stage, that would be ideal -- but it's still far off at #10. For now, we'll have to work with what we've got, especially from Tech and Communication Services, with potential boosts from Financials and Industrials. Utilities are likely to be a drag while they remain in the top five, given the current bullish market sentiment.
#StayAlert and have a great week. --Julius
|
| READ ONLINE → |
|
|
|
| Trading Places with Tom Bowley |
| Is This Rally Sustainable? You Better Bet Your Bullish Sweet Dollar It Is! |
| by Tom Bowley |
Below is the EB Weekly Market Report that I sent out earlier to our EarningsBeats.com members. This will give you an idea of the depth of our weekly report, which is a very small piece of our regular service offerings. We called both the stock market top in February and stock market bottom in April, and encouraged EB members to lower risk at the time of the former and increase risk at the time of the latter.
There is no better time to experience our service for yourself as we're currently running a FLASH SALE that offers a 20% discount on annual memberships. The timing to join couldn't be better as I'll be providing my Q3 outlook to all EB annual members at 5:30pm ET today. A recording will be provided for those who cannot attend the session live. So if you sign up later today or tomorrow or the next day, we'll make sure you get a time-stamped copy of the recording.
In the meantime, enjoy this complimentary copy of this week's report....
ChartLists/Spreadsheets Updated
The following ChartLists/Spreadsheets were updated over the weekend:
- Strong Earnings (SECL)
- Strong Future Earnings (SFECL)
- Strong AD (SADCL)
- Raised Guidance (RGCL)
- Bullish Trifecta (BTCL)
- Short Squeeze (SSCL)
- Leading Stocks (LSCL)
- Manipulation Spreadsheet*
*We continued to add more stocks to our Manipulation Spreadsheet and you'll see that a few have tabs, but do not have data yet. Those 3 are still "under construction". I also added a "Summary" tab where I've begun to sort the individual stocks in order based on a proprietary relative AD ranking system. Don't ask me what it means yet, because it's still very much a work in progress as well. I'm looking at the intraday relative performance of individual stocks vs. the benchmark S&P 500. So positive percentages represent better intraday AD performance than the S&P 500, while negative percentages represent the opposite. One thing I'll be watching is to see if stronger relative AD lines precede relative strength in stocks on a forward-looking basis. It certainly did in the case of both Netflix (NFLX) and Microsoft (MSFT) from several weeks ago when I pointed out what appeared to me to be significant accumulation in March/April when the stock market bottomed. Both NFLX and MSFT have soared since that time. I'll keep everyone posted on the progress of my research over the next many weeks and months.
Weekly Market Recap
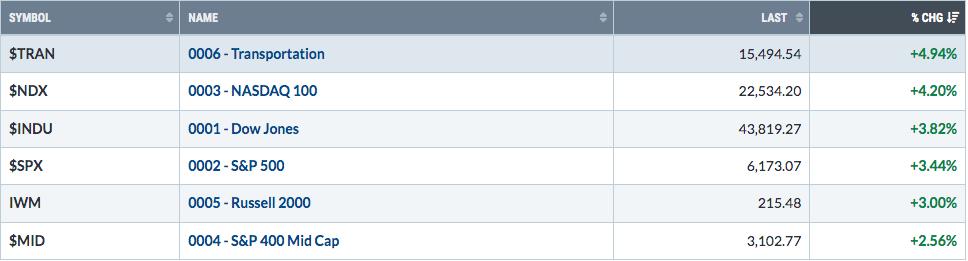
Major Indices
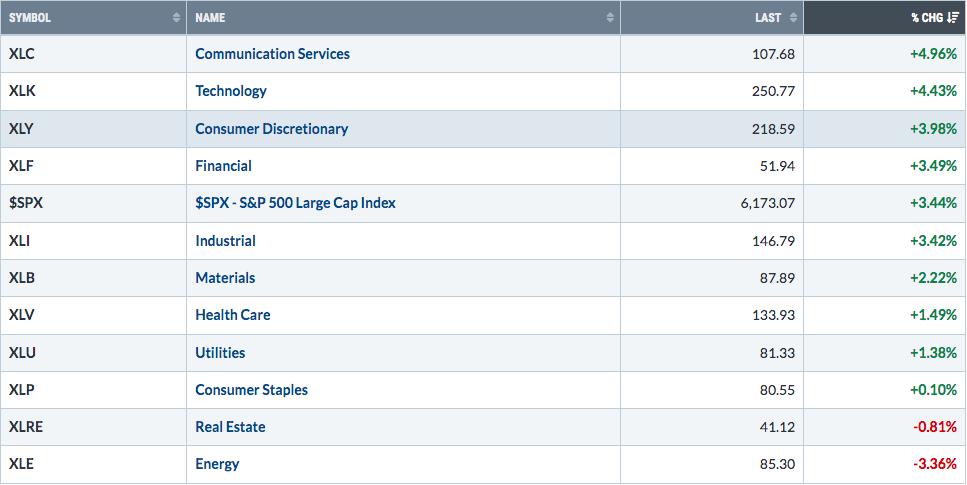
Sectors
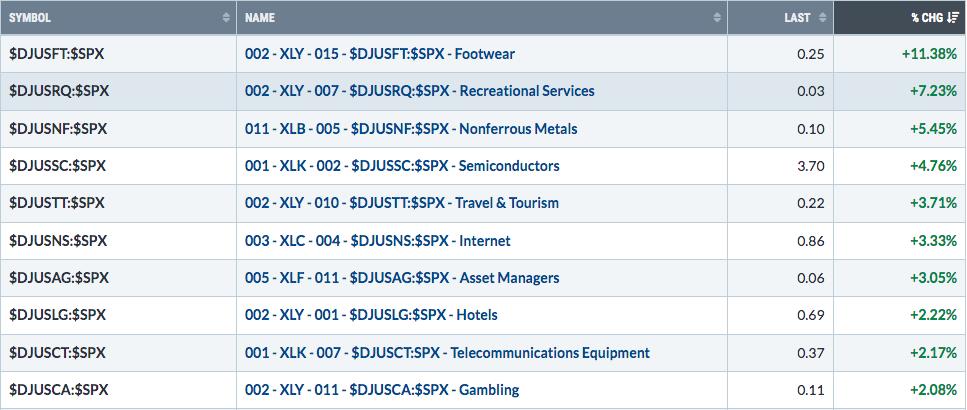
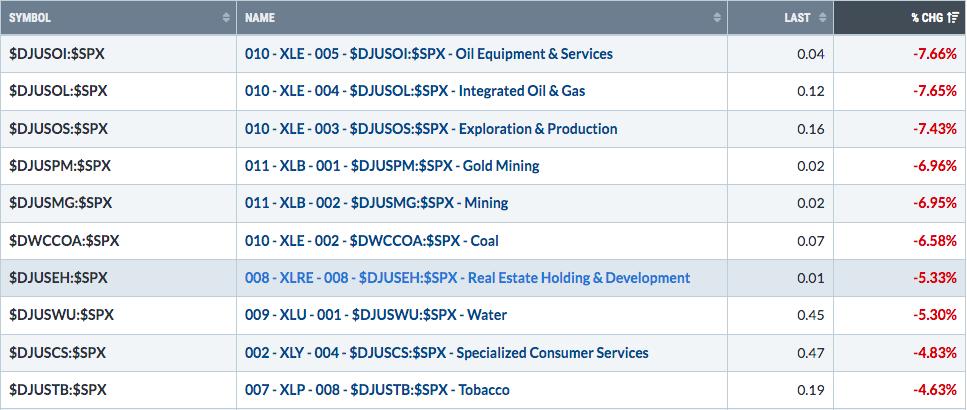
Top 10 Industries Last Week
Bottom 10 Industries Last Week
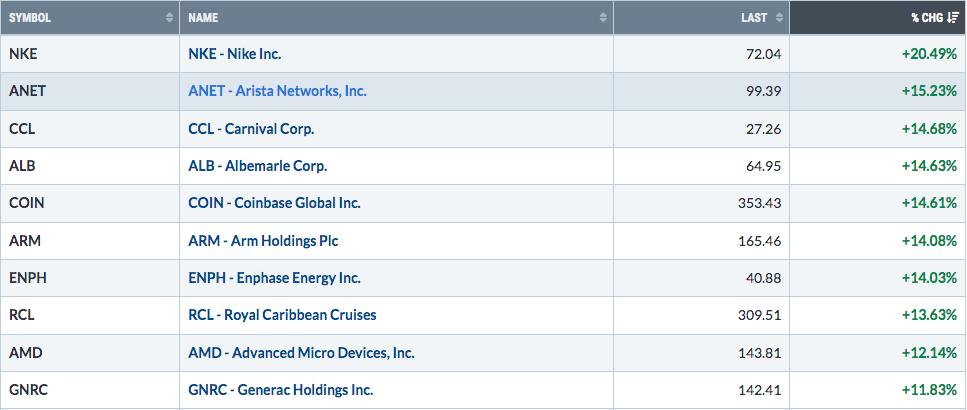
Top 10 Stocks - S&P 500/NASDAQ 100
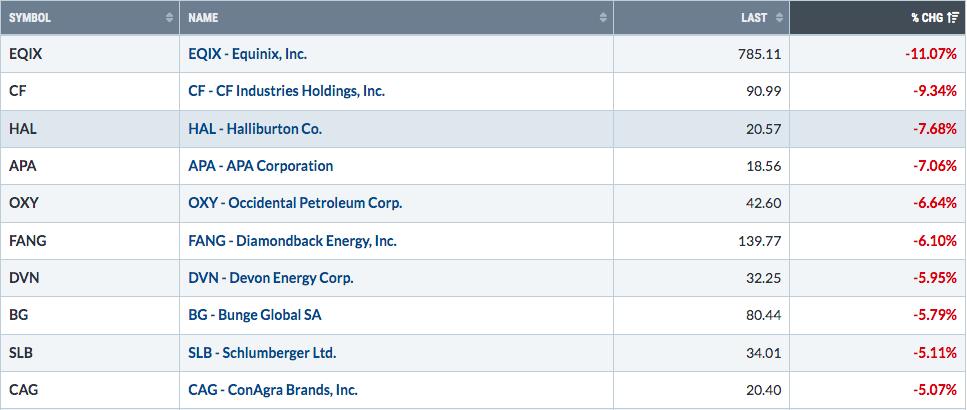
Bottom 10 Stocks - S&P 500/NASDAQ 100
Big Picture
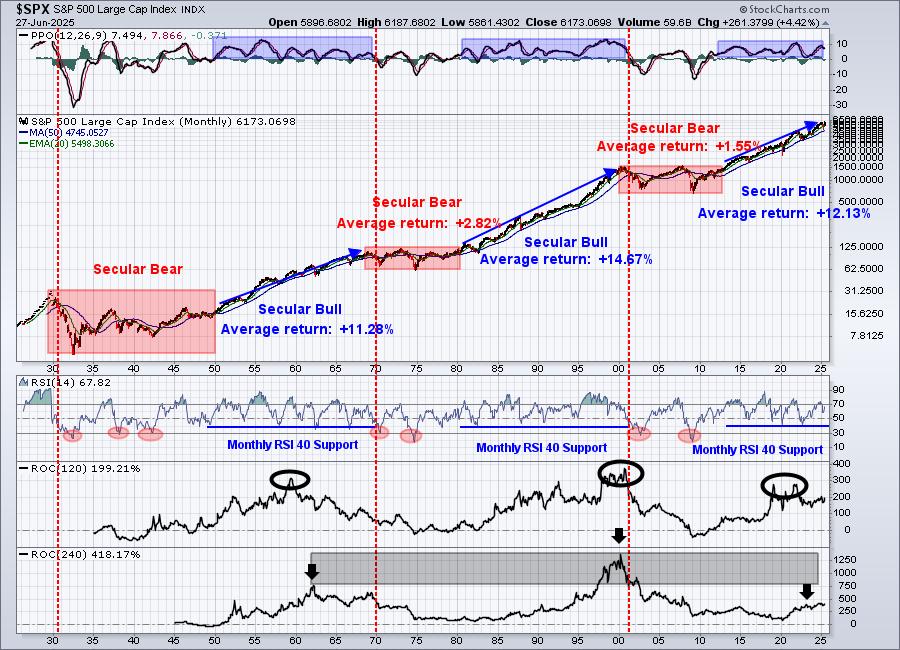
If you're a long-term investor, stepping back and looking at the stock market using this 100-year chart enables you to avoid pulling unnecessary sell triggers, because of the media, permabears, negative nellie's, and all the "news" out there. The above chart never once flashed anything remotely signaling a sell signal and now, here we are, back at all-time highs. Simply put, it filters out all the noise that we hear on a day-to-day basis and keeps our wits about us.
Sustainability Ratios
Here's the latest look at our key intraday ratios as we follow where the money is traveling on an INTRADAY basis (ignoring gaps):
QQQ:SPY
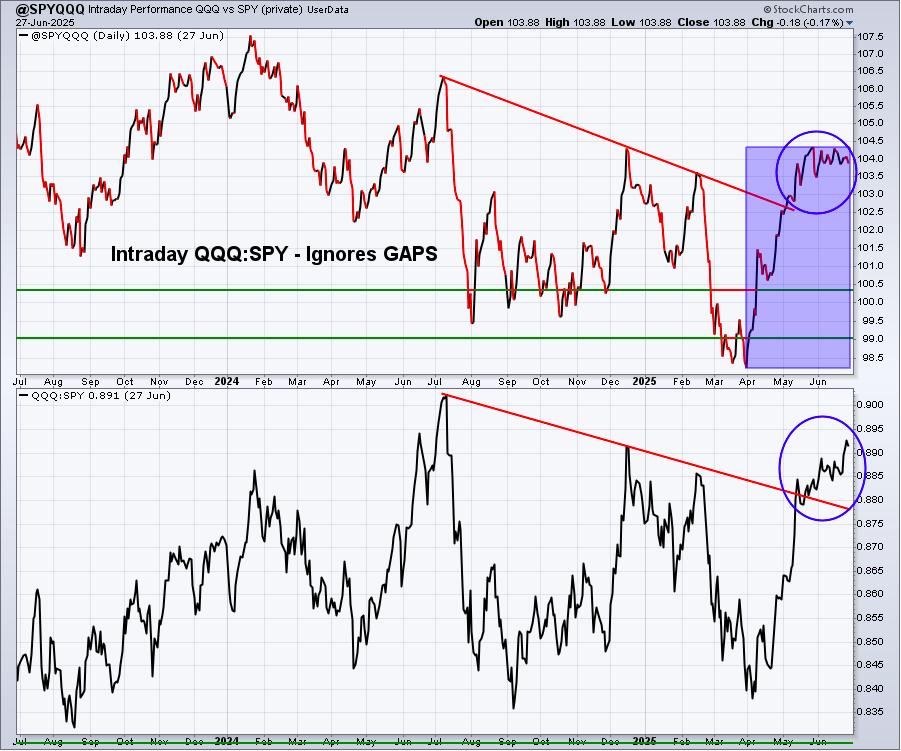
Absolute price action on both the S&P 500 and NASDAQ 100 has now seen all-time high breakouts, which alone is quite bullish. We want to see aggressive vs. defensive (or growth vs. value) ratios moving higher to indicate sustainability of any S&P 500 advance. In my view, we're seeing that. But the intraday QQQ:SPY ratio continues to hesitate. A breakout in this intraday relative ratio would most definitely add to the current bullish market environment.
IWM:QQQ
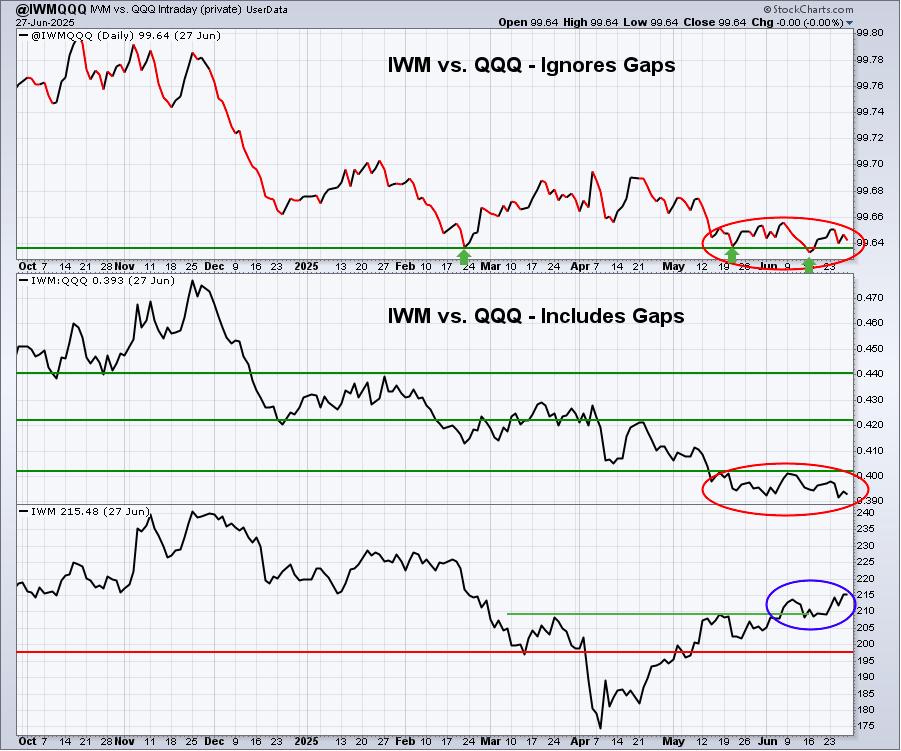
I'm seeing signs of an impending rate cut by the Fed. However, if I'm being completely honest, one signal that we should see is outperformance in small caps and a rising IWM:QQQ ratio. That hasn't happened - at least not yet. If a rate cut starts to become clearer, I would absolutely expect to see much more relative strength in small caps. Keep an eye out for that.
XLY:XLP
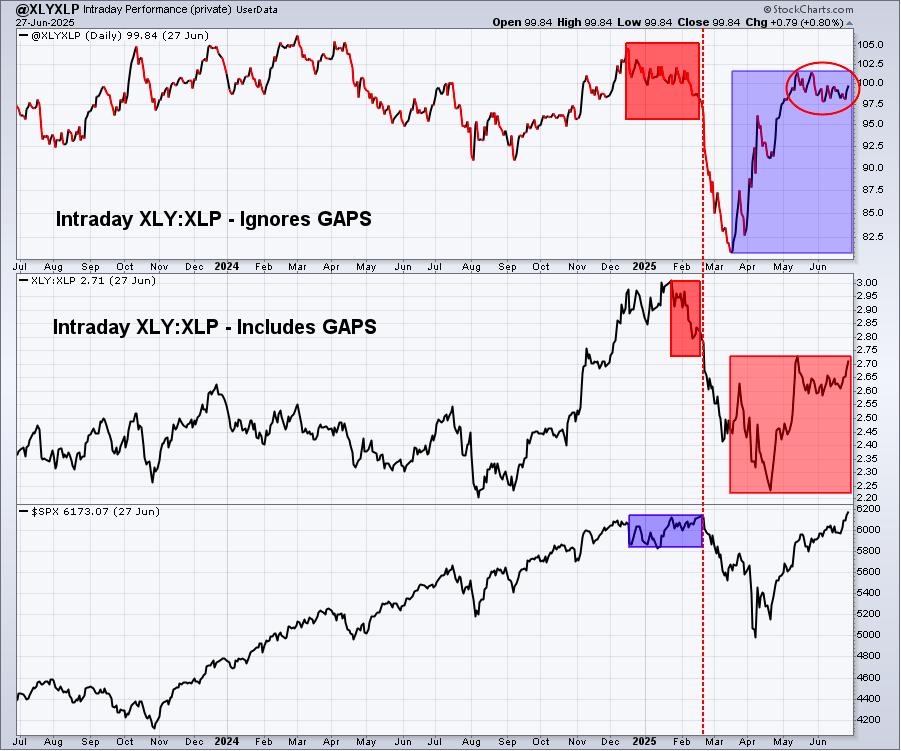
I pay very close attention to the XLY:XLP ratio and, more specifically, this INTRADAY XLY:XLP ratio. This chart helped me feel confident in calling a market top back in January/February. If you recall, that's when we said it was waaaaay too risky to be long the U.S. stock market. By the time we had bottomed in April, the blue-shaded area highlighted the fact that the XLY vs. XLP ratio had already begun to SOAR! That's why, on Friday, April 11th, I said I was ALL IN on the long side again.
These signals are golden and, when used in conjunction with all of our other signals, can provide us extremely helpful clues about stock market direction. If these ratios begin to turn lower in a big way, then yes we'll need to grow more cautious. However, right now, they couldn't be any more bullish. Expect higher prices ahead.
Sentiment
5-day SMA ($CPCE)
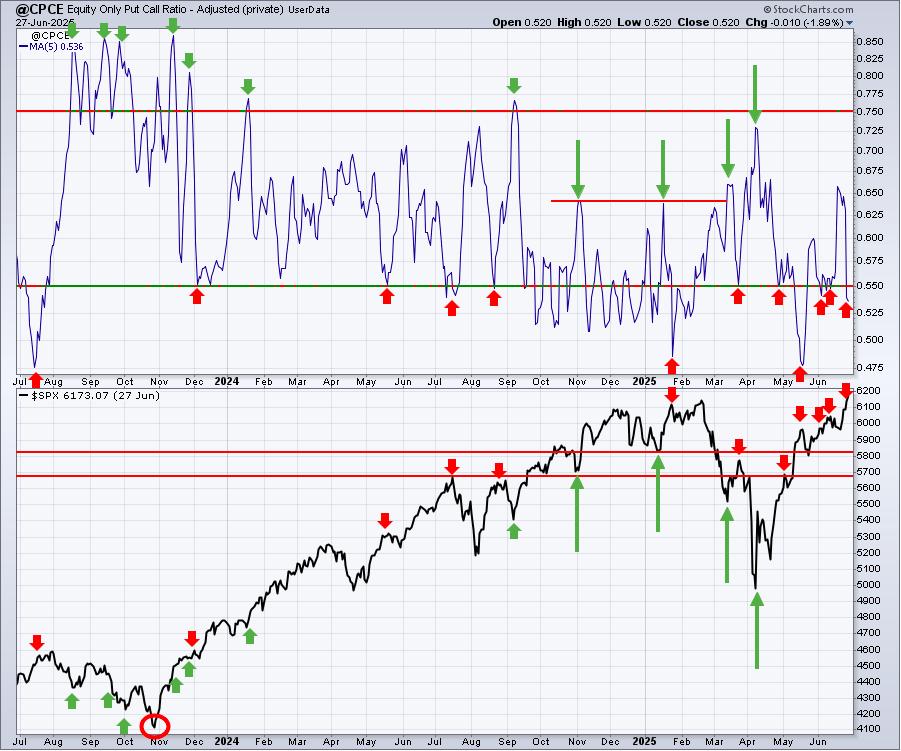
Sentiment indicators are contrarian indicators. When they show extreme bullishness, we need to be a bit cautious and when they show extreme pessimism, it could be time to become much more aggressive. Major market bottoms are carved out when pessimism is at its absolute highest level.
The S&P 500 had struggled a bit once 5-day SMA readings of the CPCE fell to the .55 area, a sign of market complacency and a possible short-term top. We saw a bit of a pullback in June, which many times is all we get during a secular bull market advance. My sustainability ratios are supporting a higher move by stocks and I know from history that overbought conditions can remain overbought. I also know that sentiment does a much better job of calling bottoms than it does calling tops. That's why I will not overreact every time this 5-day moving average of the CPCE falls back below .55. During Q4 2024, we saw plenty of 5-day SMA readings below .55 and, while the S&P 500 was choppy, bullishness prevailed throughout. So just please always keep in mind that these 5-day SMA readings are our "speed boat" sentiment indicator that changes quite frequently. When it lines up with other bearish or topping signals, we should take note. But reacting to every subtle move in this chart is a big mistake, in my opinion.
253-day SMA ($CPCE)
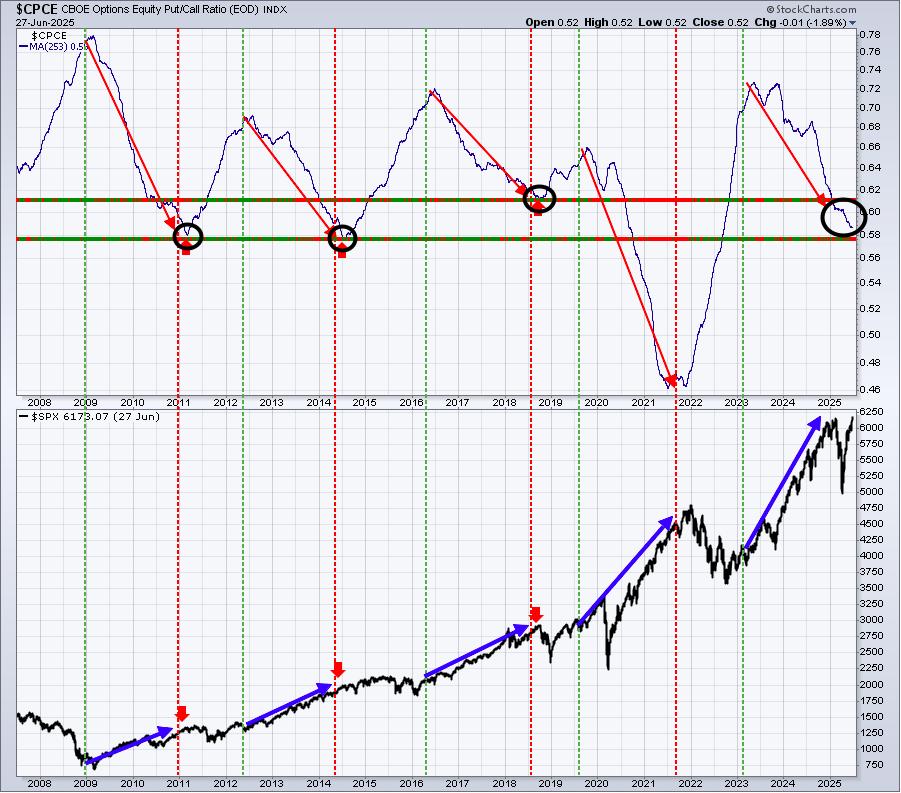
This longer-term 253-day SMA of the CPCE is our "ocean-liner" signal, unlike our speedboat indicator. This one usually provides us a very solid long-term signal as the overall market environment moves from one of pessimism to complacency and vice versa. Look at the above chart. When the 253-day SMA is moving lower like it is now, it accompanies our most bullish S&P 500 moves. It makes perfect common sense as well. Once this 253-day SMA moves to extremely high levels and begins to roll over, the bears have already sold. We typically have nowhere to go on our major indices, except higher once sentiment becomes so bearish. The opposite holds true when the 253-day SMA reaches extreme complacency and starts to turn higher. We saw that to start 2022, which, at the time, I stated was my biggest concern as we started 2022. If you recall, I said to look for a 20-25% cyclical bear market over a 3-6 month period on the first Saturday in January 2022. The above chart was my biggest reason for calling for such a big selloff ahead of the decline.
These charts matter.
Long-Term Trade Setup
Since beginning this Weekly Market Report in September 2023, I've discussed the long-term trade candidates below that I really like. Generally, these stocks have excellent long-term track records, and many pay nice dividends that mostly grow every year. Only in specific cases (exceptions) would I consider a long-term entry into a stock that has a poor or limited long-term track record and/or pays no dividends. Below is a quick recap of how these stocks looked one week ago:
- JPM - challenging all-time high
- BA - substantial improvement, would like to see 185-190 support hold
- FFIV - very bullish action above its 20-month SMA
- MA - very steady and bullish long-term performer
- GS - trending higher above 20-month EMA
- FDX - trying to clear falling 20-week EMA
- AAPL - monthly RSI at 50, which has been an excellent time to buy AAPL over the past two decades
- CHRW - 85-90 is solid longer-term support
- JBHT - would like to see 120-125 support hold
- STX - long-term breakout in play, excellent trade
- HSY - breaking above 175 would be intermediate-term bullish
- DIS - now testing key price resistance in 120-125 range
- MSCI - monthly RSI hanging near 50, solid entry
- SBUX - moved back above 50-week EMA, short-term bullish
- KRE - long-term uptrend remains in play
- ED - has been a solid income-producer and investment since the financial crisis low in 2009
- AJG - few stocks have been steadier to the upside over the past decade
- NSC - continues to sideways consolidate in very bullish fashion
- RHI - trending down with potential sight set on 30
- ADM - looks to be reversing higher off long-term price support near 43
- BG - 65-70 price support held, now looking to clear 50-week SMA to the upside
- CVS - excellent support at 45 or just below, just failed on bounce at 50-month SMA at 72
- IPG - monthly RSI now at 37 and also testing 4-year price support near 22.50
- HRL - long-term price support at 25 and stock now showing positive divergence on monthly chart - bullish
- DE - one of the better 2025 momentum stocks on this list
Keep in mind that our Weekly Market Reports favor those who are more interested in the long-term market picture. Therefore, the list of stocks above are stocks that we believe are safer (but nothing is ever 100% safe) to own with the long-term in mind. Nearly everything else we do at EarningsBeats.com favors short-term momentum trading, so I wanted to explain what we're doing with this list and why it's different.
Also, please keep in mind that I'm not a Registered Investment Advisor (and neither is EarningsBeats.com nor any of its employees) and am only providing (mostly) what I believe to be solid dividend-paying stocks for the long term. Companies periodically go through adjustments, new competition, restructuring, management changes, etc. that can have detrimental long-term impacts. Neither the stock price nor the dividend is ever guaranteed. I simply point out interesting stock candidates for longer-term investors. Do your due diligence and please consult with your financial advisor before making any purchases or sales of securities.
Looking Ahead
Upcoming Earnings
Very few companies will report quarterly results until mid-April. The following list of companies is NOT a list of all companies scheduled to report quarterly earnings, however, just key reports, so please be sure to check for earnings dates of any companies that you own. Any company in BOLD represents a stock in one of our portfolios and the amount in parenthesis represents the market capitalization of each company listed:
- Monday: None
- Tuesday: STZ ($29 billion)
- Wednesday: None
- Thursday: None
- Friday: None
Key Economic Reports
- Monday: June Chicago PMI
- Tuesday: June PMI manufacturing, June ISM manufacturing, May construction spending, May JOLTS
- Wednesday: June ADP employment report
- Thursday: Initial jobless claims, June nonfarm payrolls, unemployment rate & average hourly earnings, May factory orders, June ISM services
- Friday: None - stock market closed in observance of Independence Day
Historical Data
I'm a true stock market historian. I am absolutely PASSIONATE about studying stock market history to provide us more clues about likely stock market direction and potential sectors/industries/stocks to trade. While I don't use history as a primary indicator, I'm always very aware of it as a secondary indicator. I love it when history lines up with my technical signals, providing me with much more confidence to make particular trades.
Below you'll find the next two weeks of historical data and tendencies across the three key indices that I follow most closely:
S&P 500 (since 1950)
- Jun 30: +34.34%
- Jul 1: +72.77%
- Jul 2: +16.76%
- Jul 3: +77.19%
- Jul 4: +0.00% (market closed - holiday)
- Jul 5: +39.40%
- Jul 6: +22.32%
- Jul 7: +17.62%
- Jul 8: -16.29%
- Jul 9: +76.54%
- Jul 10: -16.59%
- Jul 11: +13.23%
- Jul 12: +36.89%
- Jul 13: -5.67%
NASDAQ (since 1971)
- Jun 30: +73.30%
- Jul 1: +63.18%
- Jul 2: -47.43%
- Jul 3: +46.02%
- Jul 4: +0.00% (market closed - holiday)
- Jul 5: +7.04%
- Jul 6: -10.79%
- Jul 7: +60.19%
- Jul 8: -10.10%
- Jul 9: +86.44%
- Jul 10: -27.94%
- Jul 11: +11.18%
- Jul 12: +128.28%
- Jul 13: +61.52%
Russell 2000 (since 1987)
- Jun 30: +99.14%
- Jul 1: +30.53%
- Jul 2: -113.05%
- Jul 3: +44.57%
- Jul 4: +0.00% (market closed - holiday)
- Jul 5: -4.89%
- Jul 6: -76.61%
- Jul 7: +43.95%
- Jul 8: +37.24%
- Jul 9: +31.88%
- Jul 10: -17.39%
- Jul 11: +29.75%
- Jul 12: +89.15%
- Jul 13: +63.13%
The S&P 500 data dates back to 1950, while the NASDAQ and Russell 2000 information date back to 1971 and 1987, respectively.
Final Thoughts
All-time highs are always a time for me to say "I told you so" to the bears, since I've been a firm believer that we remain in a secular bull market advance - one in which we should EXPECT to see higher prices and all-time highs. This latest rally is being fully supported by risk-on areas of the market, which will almost certainly lead for more and more all-time highs down the road.
Here are several things I'm watching this week:
- Jobs. The ADP employment report will be out on Wednesday and the more-closely-watched nonfarm payrolls will be released on Thursday this week since the stock market is closed on Friday. ANY sign of weakness in these reports will begin to put mounting pressure on the Fed to cut rates in late July at their next meeting.
- Technical Price Action. Any time we're setting new all-time highs, I start off with a bullish mindset. I only turn bearish if I'm inundated with warning signals. Currently, I see few of those.
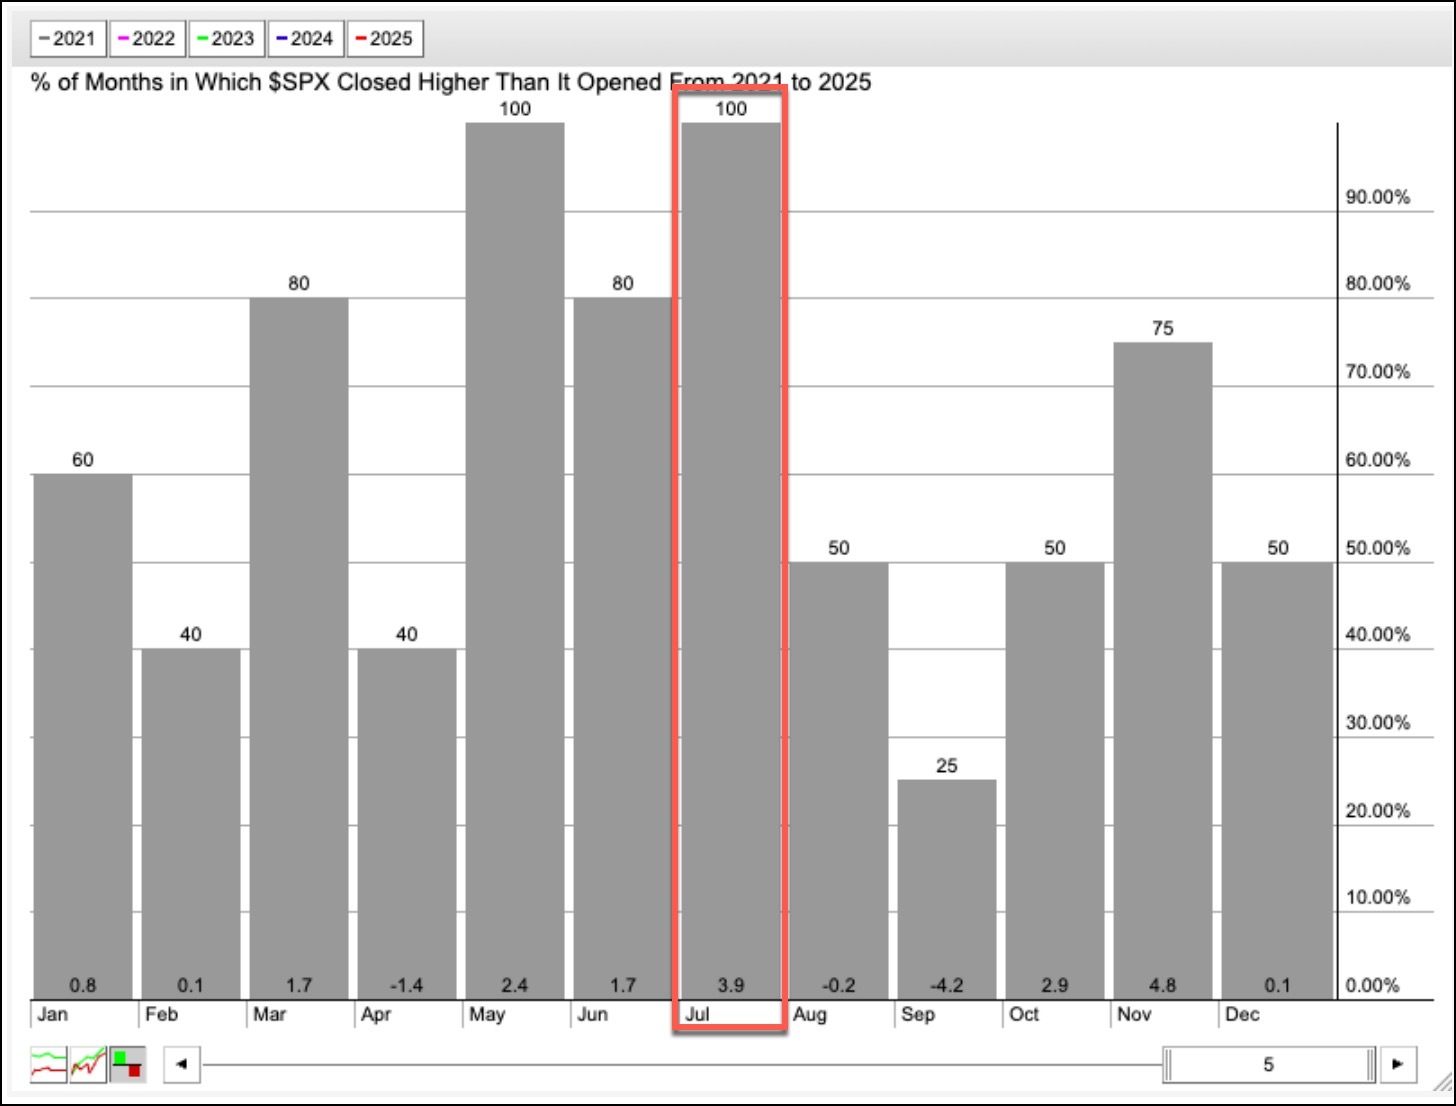
- History. We can now turn our attention to upcoming earnings season and, historically, that's a bullish thing. Pre-earnings season runs to the upside are common and, if you scroll up and check out historical returns for days over the next couple weeks, you'll see that July normally performs well - especially the first half of the month.
- 10-Year Treasury Yield ($TNX). The 10-year treasury yield has been in decline for 3 straight weeks, falling from 4.52% on June 9th to 4.24% just a few minutes ago. The money rotating into bonds is a very strong signal that inflation is NOT a problem. It's also a signal that the Fed "should be" considering a rate cut at its next meeting.
- Breakouts. We've seen big breakouts in key areas like semiconductors ($DJUSSC), software ($DJUSSW), and investment services ($DJUSSB), but there will be plenty more. Travel & tourism ($DJUSTT) joined the party on Thursday. Banks ($DJUSBK) are on the verge of a breakout. The way I look at it? The more the merrier!
Happy trading!
Tom
|
| READ ONLINE → |
|
|
|
| Don't Ignore This Chart! |
| Should You Buy Roblox Stock Now? Key Levels to Watch |
| by Karl Montevirgen |
 Roblox Corporation (RBLX), the company behind the immersive online gaming universe, has been on a strong run since April. This isn't the first time the stock demonstrated sustained technical strength: RBLX has maintained a StockCharts Technical Rank (SCTR) above 90, aside from a few dips, since last November. Roblox Corporation (RBLX), the company behind the immersive online gaming universe, has been on a strong run since April. This isn't the first time the stock demonstrated sustained technical strength: RBLX has maintained a StockCharts Technical Rank (SCTR) above 90, aside from a few dips, since last November.
Currently, RBLX is showing up on a few scans that may signal an opportunity for those who are bullish on the stock. It currently ranks among the SCTR Report Top 10, but also appeared on a few cautionary scans, including the Parabolic SAR Sell Signals and Overbought with a Declining RSI scans (both of which are available in the StockCharts Sample Scan Library).
So here's the question: Is RBLX a strong stock that's about to undergo a buyable dip?
Weekly Chart: Key Breakout and Resistance Levels
Before we explore that question, let's take a look at a weekly chart for a broader perspective.

FIGURE 1. WEEKLY CHART OF RBLX. The stock is barely above halfway between its three-year lows and highs. If it delivers the growth investors expect, you could see another leg higher once the pullback completes.
The weekly chart shows RBLX trading in a broad range from late 2022 to late 2024, repeatedly failing to clear resistance near $47–$48. When it finally broke out in November, the stock's technical strength was reflected in its SCTR score, which held a sustained position above the 90 line save a few declines.
Breaking above the $47–$48 resistance was a key move, as that level turned into support in December and again in April, where RBLX established a base ahead of its current rally. The subsequent move up was sharp, arguably even parabolic, peaking at $106.17 before pulling back.
If you look closely, you'll see a swing high at around the $125 level (December 2022). This marks a technical level that happens to align with several Wall Street price targets. The blue line at $140 marks RBLX's all-time high. Both levels can serve as potential price targets and are also likely to act as resistance.
RBLX is a technically strong stock that is fundamentally robust, despite remaining unprofitable on a GAAP basis. With strong user engagement, accelerating revenue growth, and plenty of free cash flow, it's a favorable growth stock. However, it's overbought. So, for those looking to get in, what are the key levels to watch out for?
Daily Chart: Fixed and Dynamic Support Levels to Watch
Let's shift over to a daily chart.

FIGURE 2. DAILY CHART OF RBLX. Although the stock is currently overbought, there are plenty of support levels below. If you're bullish on the stock, now's the time to add RBLX to your ChartLists and set price alerts.
The strength of RBLX's current surge is highlighted by the Bollinger Bands. The stock has been "walking the band" over the past two months. Now that it has pulled back, it appears to be bouncing off the middle band, suggesting that investors are still accumulating the stock.
As far as the pullback is concerned, the Money Flow Index (MFI), a volume-weighted Relative Strength Index (RSI), shows that RBLX entered overbought territory in May and began declining in late June, revealing a divergence between MFI and price—an early signal that RBLX was about to pull back. That pullback materialized on Tuesday. Whether it continues in the coming sessions is something we'll have to see. In contrast, the Chaikin Money Flow (CMF), a measure of volume-based momentum, suggests that buying pressure is still relatively strong.
Whether RBLX continues advancing or pulls back in the near term, keep an eye on the Bollinger Bands for potential support. You may also encounter a bounce and favorable entry point at $92.50, a "local" swing low.
Another stronger support level sits near $75, aligning with the February and April swing highs. HOWEVER, that's a huge drop; if the price falls toward this level, you'd have to reevaluate the stock's momentum, volume, market sentiment, and the broader economic factors that may be driving such a decline.
When to Consider Entering RBLX
If you're bullish on the stock, RBLX is something you'll want to monitor in the days ahead. Add it to your ChartLists and observe how it acts within the context of the Bollinger Bands. If the stock declines further, you may want to set a price alert at $92.50 to see how price responds to this recent swing low. As mentioned above, further declines would warrant a re-evaluation, so keep a close eye on the price action.
Is Roblox Stock Still a Buy?
RBLX's surge reflects growing optimism about the company's future growth prospects. While it isn't profitable yet by GAAP standards, its strong performance relative to analyst expectations and its strong free cash flow have made it something of a Wall Street darling. For now, the technicals are the proof in the pudding. If it is what growth investors seek, the price action should provide evidence before the fundamentals validate it in the coming earnings quarters.
Disclaimer: This blog is for educational purposes only and should not be construed as financial advice. The ideas and strategies should never be used without first assessing your own personal and financial situation, or without consulting a financial professional.
|
| READ ONLINE → |
|
|
|
|
|
| MORE ARTICLES → |
|