The stock market may be setting records, but you deserve a breather this weekend. While you’re sipping your iced tea, take just a couple of minutes to explore the brand-new navigation menu on StockCharts.com. It’ll make your next charting session a breeze.
What’s different (and better)?
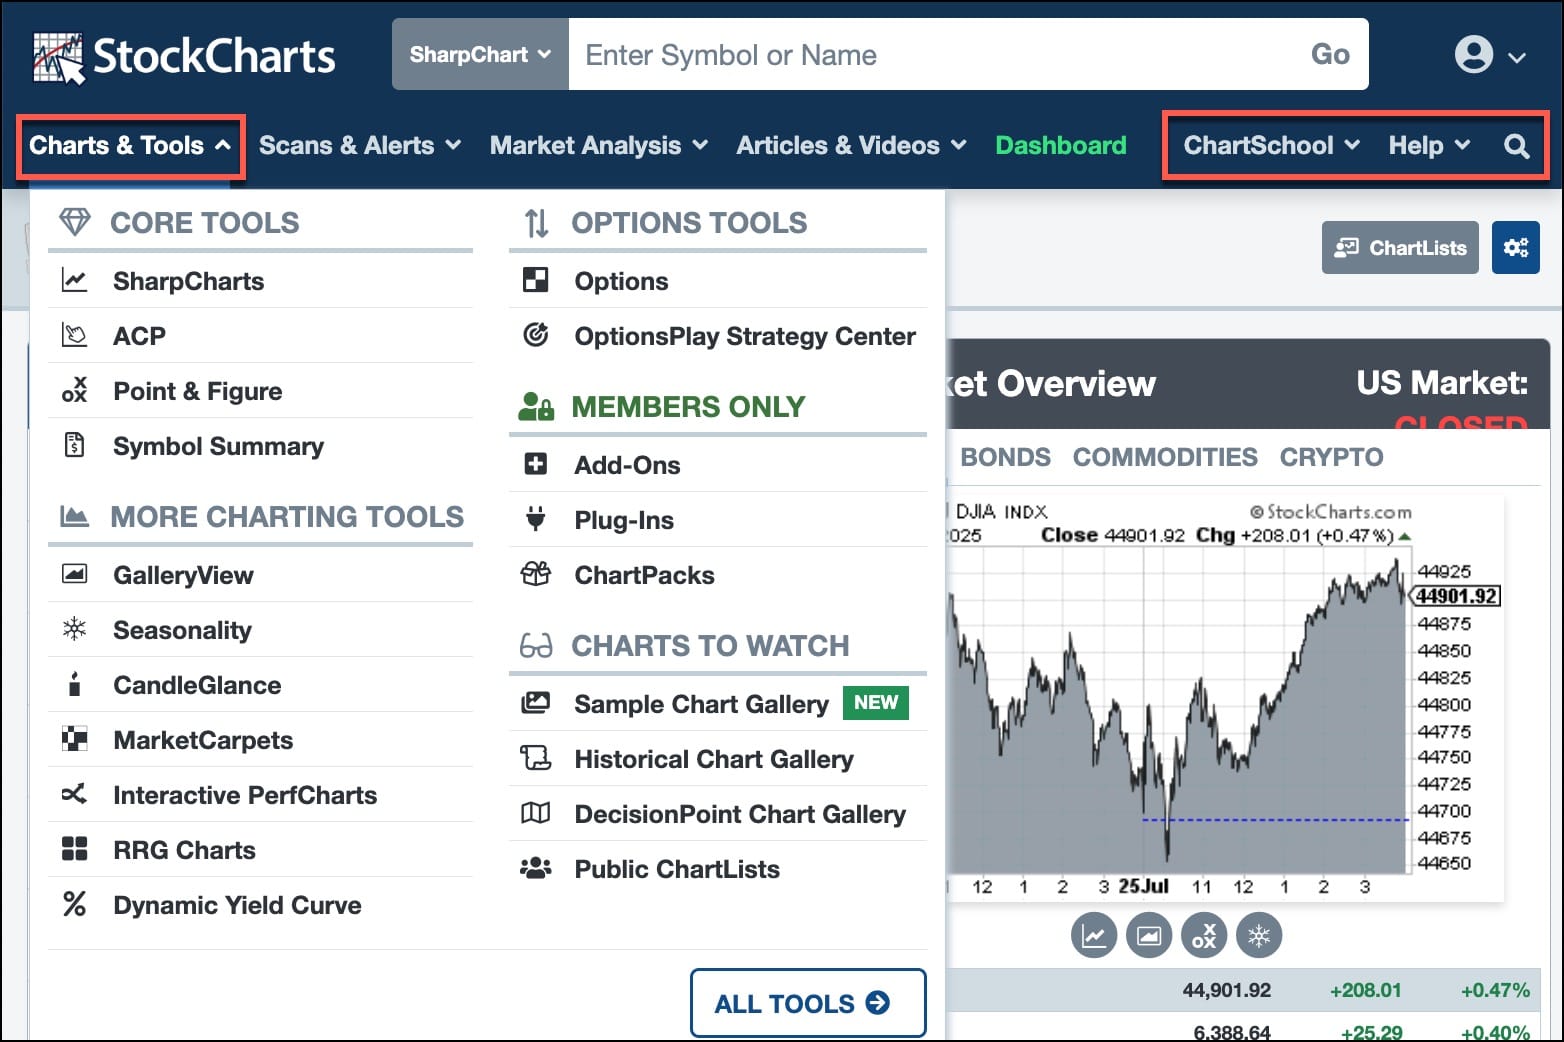
Charts & Tools: Find all our charting tools, options tools, members-only tools, and charts to watch (see screenshot above).
Scans & Alerts: Run custom or predefined scans, and set real-time alerts without hunting through menus.
Market Analysis: Access the Market Summary page, sector and industry group research, cryptocurrencies, and more data, all organized for quick insight.
Articles & Videos: Get fresh commentary from our expert authors and video hosts. You can now filter by author or topic, or hit the magnifying glass icon to search across thousands of articles in seconds.
ChartSchool: Now found on the right side of the bar, split into easy-to-browse categories.
Help: In addition to helpful resources, thisdropdown shows live System Status, so you always know everything’s running smoothly.
It’s the same powerful tools, neatly arranged so you can spend less time clicking and more time analyzing.
Relative Rotation Graphs or RRGs will help investors to keep an eye on relative trends that unfold within a universe. Among other things this will help to visualize sector rotation ...
The S&P 500 ($SPX) just logged its fifth straight trading box breakout, which means that, of the five trading ranges the index has experienced since the April lows, all have been resolved to the upside.
How much longer can this last? That's been the biggest question ...
The chart of Meta Platforms, Inc. (META) has completed a roundtrip from the February high around $740 to the April low at $480 – and all the way back again. Over the last couple weeks, META has pulled back from its retest of all-time highs, leaving investors to wonder what may ...
Emerging markets, in the form of the iShares MSCI Emerging Markets ETF (EEM), have been underperforming the DJ World Index since 2010 -- but that may be about to change.
After all, Chart 1 shows that the RS line has crossed above a three-year down trendline and experienced a long-term ...
Technology stocks cool before earnings, but the Nasdaq holds above a key moving average. See rotation, support, and key charts on StockCharts to stay ready. ...
As a StockCharts Member, you unlock all of our most powerful tools and features, including saved charts and settings, custom scans, technical alerts and much more. Discover all that StockCharts can do with our
free 1-month trial and start charting like a true market pro.