Buckle up, folks. This week, we’re bringing you not one, but two "Top 10 Stocks" videos. That means double the picks, double the fun!
So, who’s the victor in this high-stakes stock showdown? Spoiler: It’s not Dave or Grayson. The real champion is their not-so-secret weapon: technical analysis.
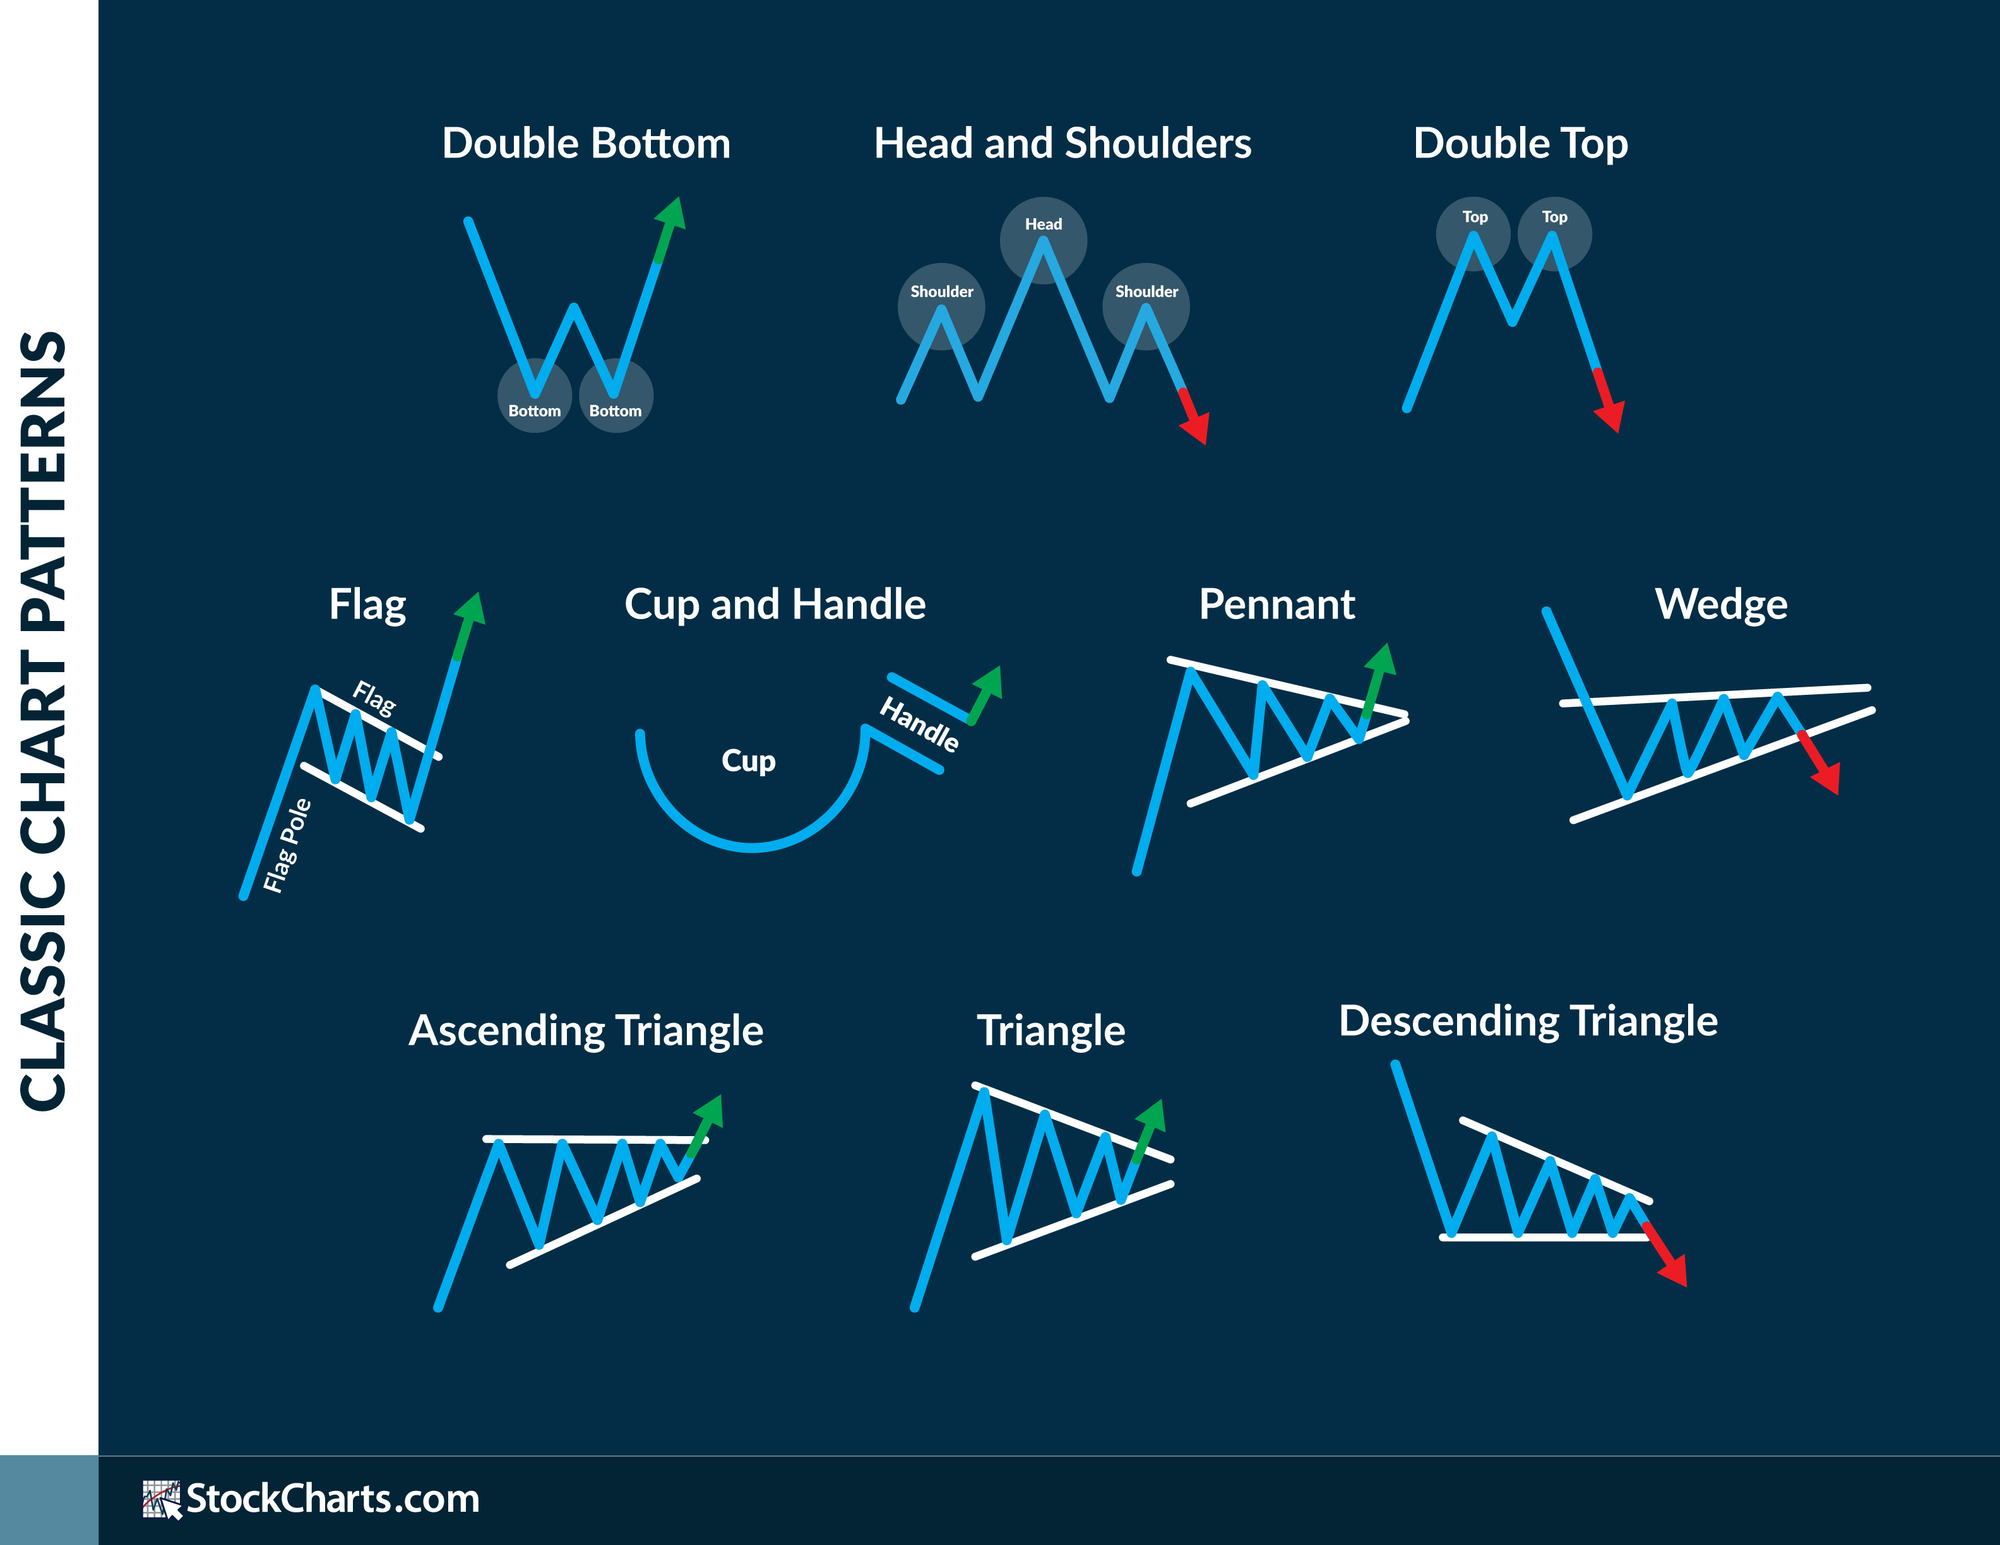
What stands out in both videos isn’t just which stocks our experts choose, but how they find them. Dave and Grayson lean entirely on the charts, tuning out the noise from headlines and market drama. No FOMO. No panic-selling. Just good, old-fashioned trend and pattern spotting (👇 is a quick refresher on chart patterns).
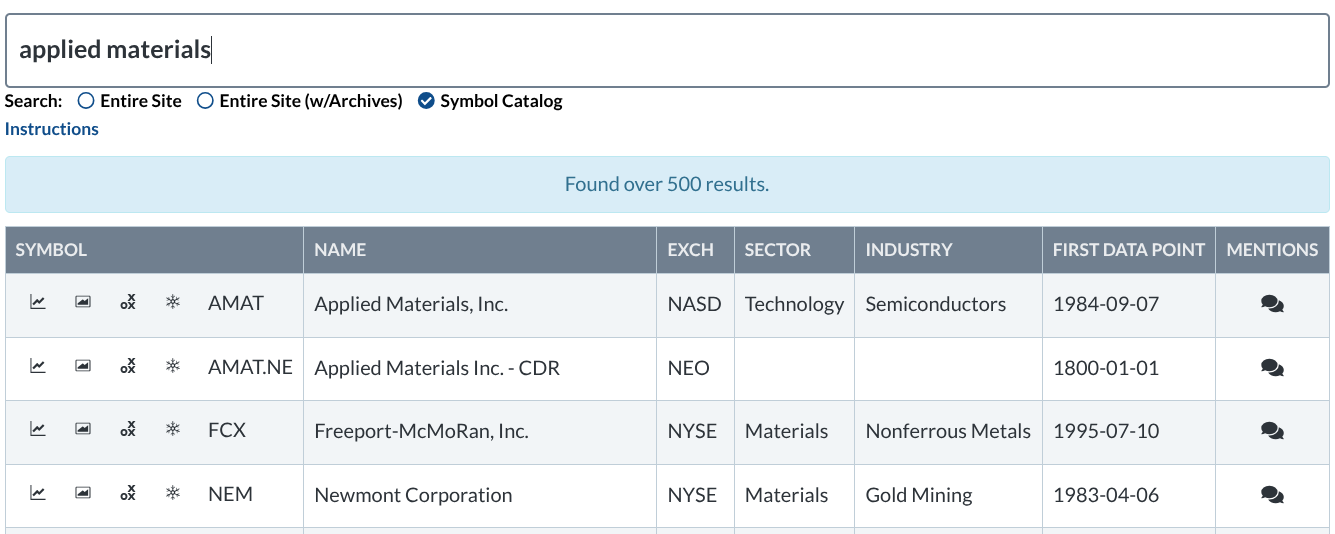
Here’s the beauty of technical analysis: there’s no single “one way” to do it. After all, no two people analyze the market the same way; everyone has different goals, different perspectives, and different styles. This is why we’re always evolving our tools. Case in point: Our navigation bar recently got a facelift, our search tool is more intuitive (check out our StockCharts Insider article for a tour), and we have expanded our crypto coverage from 150 to 500 coins. Stay tuned for our updated crypto page as well.
Between our upgraded features, expert insights, and massive library of resources, you’ve got everything you need to fine-tune your strategy and approach the market with the same sharpness as our experienced chart titans.
Oh, and one more thing…
This Saturday (that’s today), join Tom Bowley, Chief Market Strategist at EarningsBeats.com, for a free livestream at 10 AM ET (August 9, 2025). Tom will reveal his proven 2-step method for identifying high-potential stocks. This simple strategy combines fundamentals with technicals and has powered Tom's2.3x outperformance versus the S&P 500since 2018. Gain practical tips and tools to move forward with confidence. Register now by clicking here.
Here's a deep dive into the differences between the 2024 bull market and 2025 bull run, small-cap performance, the price action in Bitcoin and gold, and the Bollinger Band squeeze in Tesla's stock price. ...
Discover what Bollinger Bands and RSI are signaling for the S&P 500. Learn how low volatility and key momentum indicators could point to the next market breakout. ...
Before We Dive In…
Sure, it’s a search tool, but what matters is how you use it. StockCharts’ new search digs deep into the archive and pulls up the most relevant content. I’ll show you how I optimize its use to find indicators, tutorials, market analysis, and explainers ...
As U.S. equity indexes hit new highs, not all stocks are keeping pace. Explore these three stocks that are at key technical junctures with charts that highlight trend shifts, risk levels, and actionable signals. ...
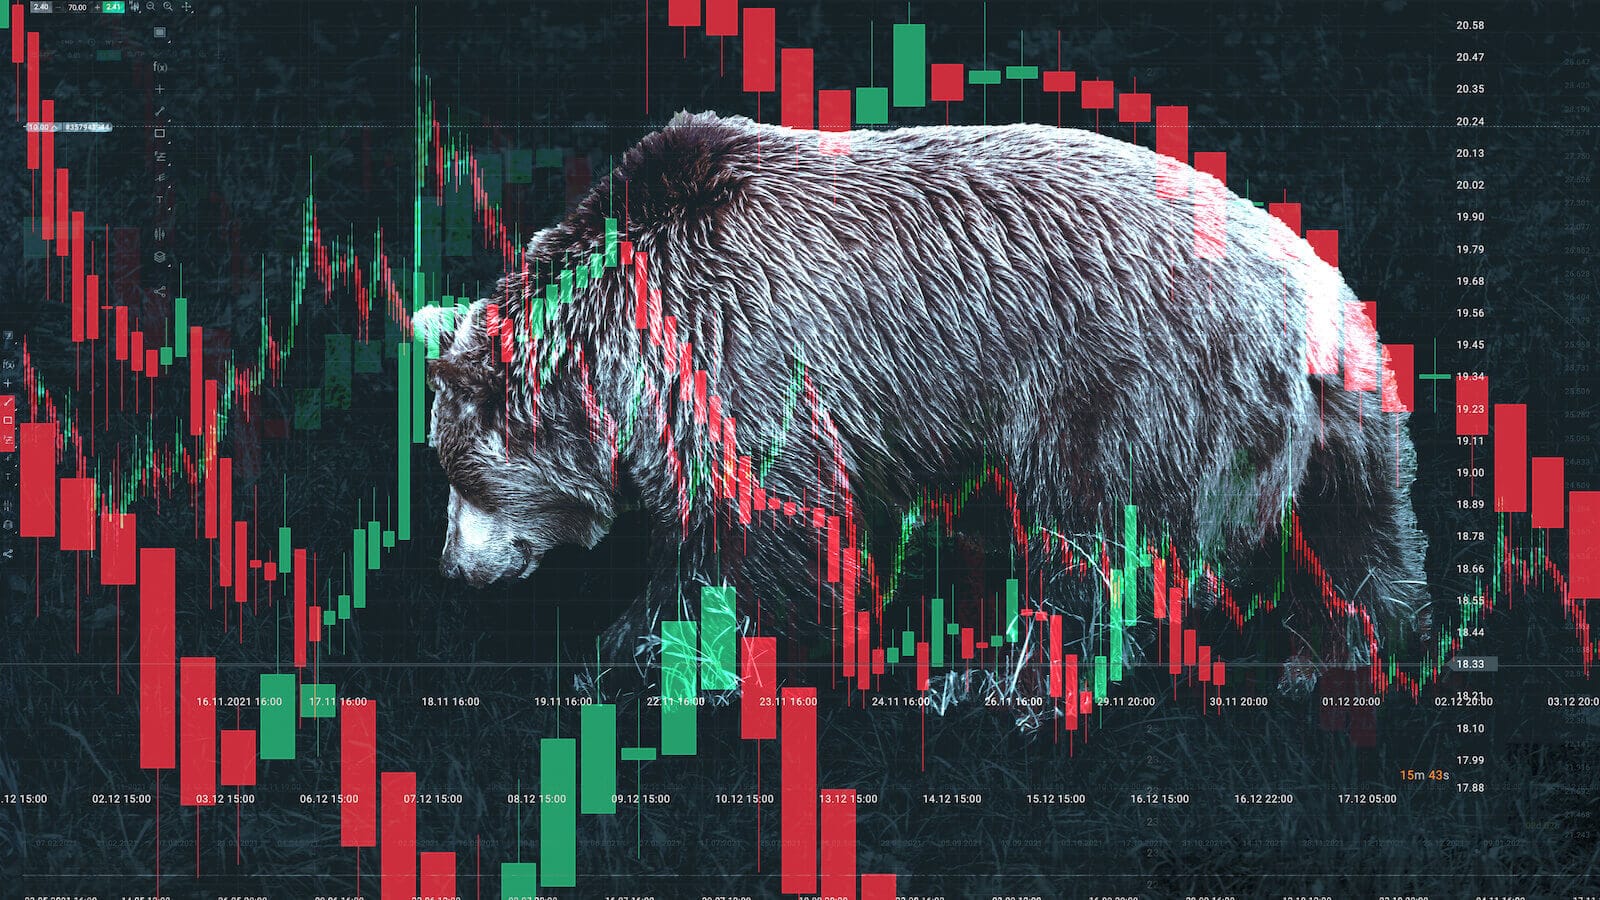
Explore how recent bearish weekly patterns in the S&P 500, Nasdaq, and Microsoft could signal an intermediate-term trend reversal. Learn why confirmation is key in technical analysis. ...
As a StockCharts Member, you unlock all of our most powerful tools and features, including saved charts and settings, custom scans, technical alerts and much more. Discover all that StockCharts can do with our
free 1-month trial and start charting like a true market pro.
You can use our Recent Data Adjustments page to view important events like IPOs, stock splits, dividends, distributions, symbol changes and stocks trading on new exchanges.