It was another interesting week on Wall Street. Just when things were looking rough, Fed Chairman Jerome Powell stepped in and gave the market just what it wanted; his comments brought investors back in, and the bulls showed they’re still in charge.
The broader indexes closed higher on Friday, with the Dow notching a new high. The S&P 500 came very close to a record close. Here’s how the major indexes wrapped up on Friday:
Dow Industrials ($INDU): 45,631.74 (+1.89%)
S&P 500 ($SPX): 6,466.91 (+1.52%)
Nasdaq Composite ($COMPQ): 21,496 (+1.88%)
That’s a pretty strong finish after what felt like a rocky few days.
A Sea of Green on the MarketCarpet
If you glanced at the StockCharts MarketCarpet on Friday, it probably brought a smile to your face, as it was mostly green across the board. Almost every S&P sector joined the party, with Consumer Staples being the lone exception (it ended the day flat).
The beauty of MarketCarpets is how easy it is to drill down. By default, it shows you one-day S&P 500 performance, but you can switch views, focus on specific asset classes or groups, or explore different sectors.
Since the S&P 500 is a cap-weighted index, big names like NVDA, MSFT, AAPL, AMZN, GOOGL, META, TSLA, and AVGO show up as the largest boxes. When those heavyweights all flash green, it tends to lift the market mood, and that’s exactly what we saw.
Beyond Stocks: Precious Metals and Crypto Shine
Friday’s bullish tone wasn’t just in equities. Precious metals ticked higher, and cryptocurrencies joined the rally too. Ether even hit a record high, giving crypto traders a reason to cheer.
What’s Coming Up
This week was a classic example of how investor sentiment can flip. Next week could bring even more excitement, with two big items on the calendar:
NVIDIA earnings
PCE report
Both of these could stir the pot.
The bulls are still running, and there’s renewed optimism heading into next week. In this week’s articles and videos, we’ll dig deeper into the market action and highlight how to use StockCharts tools to spot investment opportunities.
Stocks surged as Powell's rate-cut hints lifted markets. Dow hit a record, Nasdaq rebounded, and small caps rallied. Here's what it means for investors. ...
Earlier this summer, I pointed out that Bitcoin had experienced a bearish shooting star on the day it experienced a new all-time high, and noted that this probably foreshadowed some short-term weakness. I pointed out that no damage whatsoever had been done to the basic uptrend, as the consensus of ...
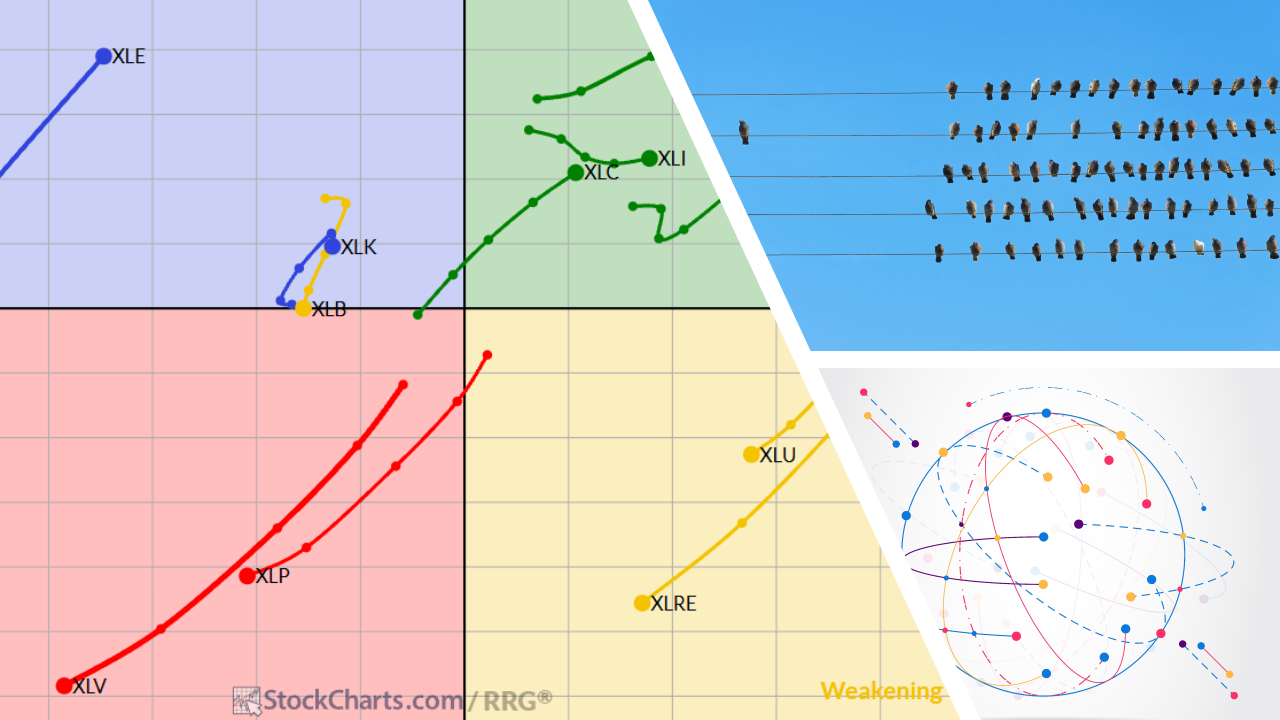
When it comes to understanding what’s really going on beneath the surface of the market, two key concepts come to mind: breadth and rotation. Breadth helps us gauge the participation behind a trend, while rotation reveals where the strength is moving within the universe we’re analyzing. Combine both, ...
Signs of correction and rotation emerged this week as money moved out of tech-related groups and into defensive groups. Here's a perspective on this week's rotation with some year-to-date performance metrics. ...
Mega cap growth names like META and MSFT are pulling back. We use the StockCharts scan engine to identify three stocks that may be taking on a new leadership role. ...
Tech stocks wobble while other sectors firm up. Learn how breadth, equal-weight trends, and small/mid-cap strength can guide your investment decisions. ...
Before We Dive In…
Have you ever wondered why the S&P 100, 400, and 600 show up in the Market Summary? They serve a purpose, mainly to give you a quick read on investor sentiment: whether Wall Street is favoring large-, mid-, or small-caps. Today, I’m going ...
As a StockCharts Member, you unlock all of our most powerful tools and features, including saved charts and settings, custom scans, technical alerts and much more. Discover all that StockCharts can do with our
free 1-month trial and start charting like a true market pro.