Just when it looked like August would end on a high note, stocks ran out of steam in the last leg. The major indexes closed lower on Friday, but the monthly performance wasn’t bad at all.
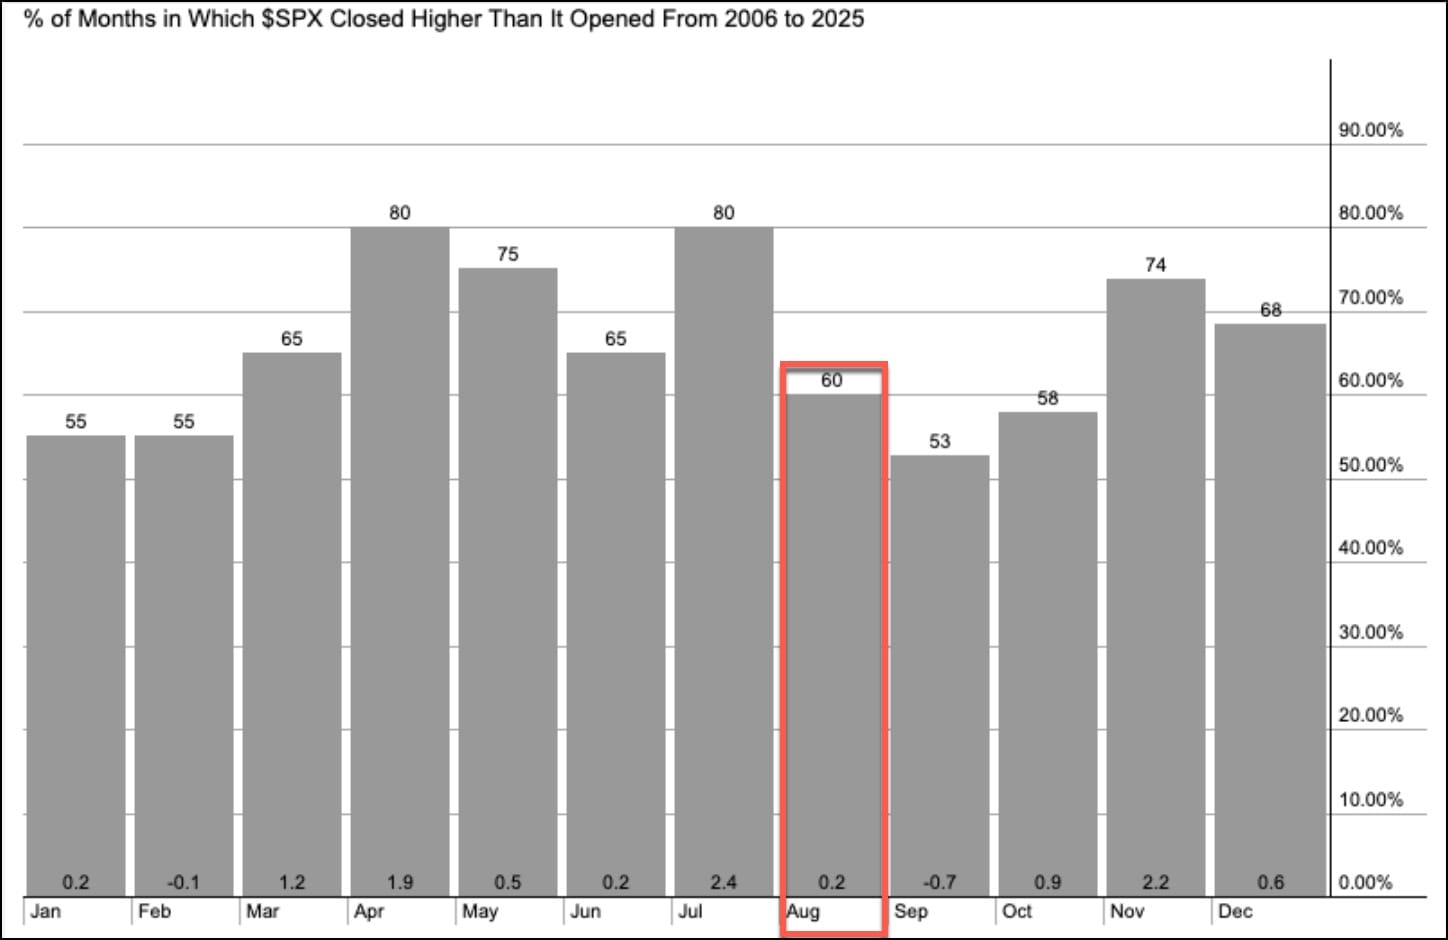
From a seasonal angle, August usually underwhelms. Over the last 20 years, the S&P 500's average August return is about +0.20%, so this year’s +1.91% cleared the average by a mile.
Here's the big picture: The uptrend in the major indexes is still in play.
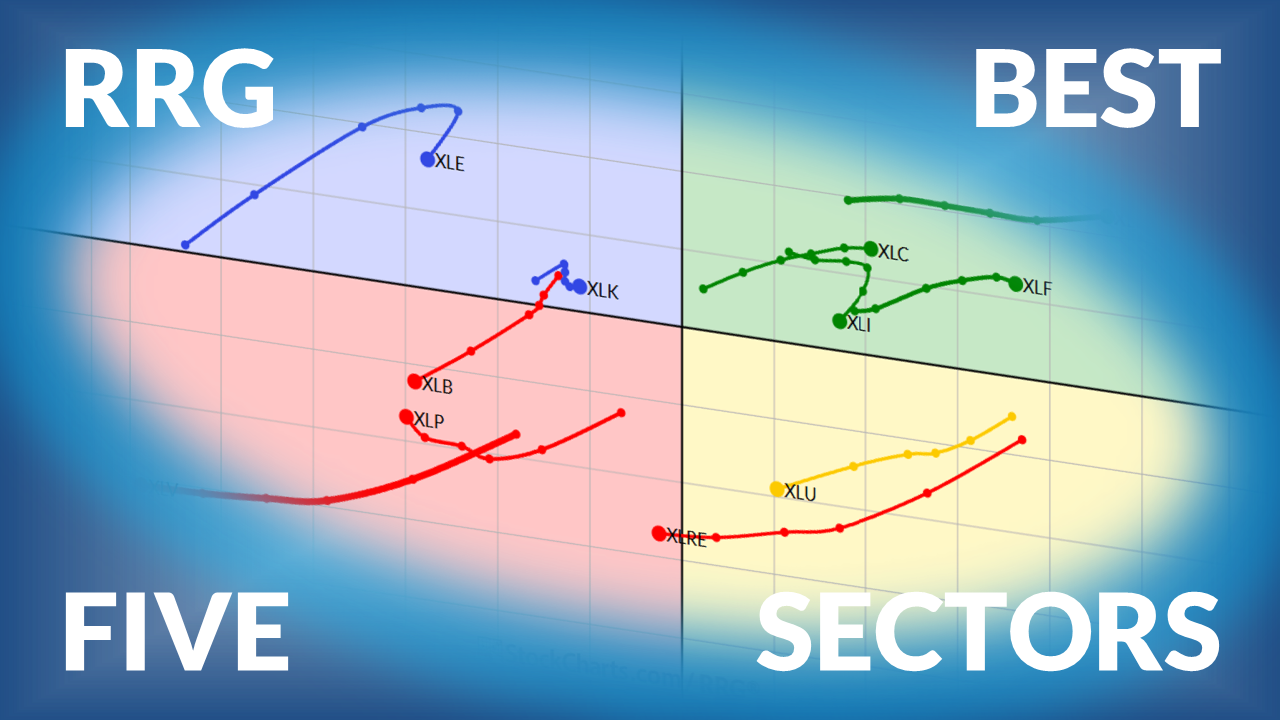
Friday’s selloff could be some pre-Labor Day profit-taking, or a sign of a little rotation. On your StockCharts Dashboard’s Sector Summary, six of the 11 S&P sectors finished in the green. Health Care and Consumer Staples led, while Consumer Discretionary and Technology lagged.
Earlier in the week, small-cap stocks gained traction as the market priced in a potential September Fed rate cut. That gave a lift to bank stocks, homebuilders, industrials, and other rate-sensitive groups. Will investors keep trimming Tech and add to those other asset groups? This is something to watch as we head into September, another seasonally weak month.
Our articles and videos dig into where the money’s moving. Explore small caps, big banks, consumer names, precious metals, and Bitcoin. Plus, know what to watch if mega-cap tech stocks reclaim the driver’s seat. And the nice thing is you’ve got an extra day to browse it all.
Market breadth is strengthening as more stocks move into long-term uptrends. The percentage of S&P 500 stocks above their 200-day moving average hit 70%. small and mid-caps are driving this expansion, signaling broad market strength. ...
The NYSE/S&P ratio has been in a downtrend for seventeen years, but is a reversal finally underway? What does the picture look like for small-caps going forward? ...
While August and September are traditionally a weak period for stocks, the Nasdaq 100 has continued to drive higher. We lay out four potential scenarios for the QQQ over the next six weeks, from the very bullish to the super bearish. ...
Consumer Discretionary ETFs are outperforming Staples across large-cap, small-cap, and global markets. See why XLY, RSPD, PSCD, and RXI signal a bullish risk-on trend in 2025. ...
Gold and silver are breaking out while stocks cool. See SLV/GLD levels, September seasonality, and how a possible Fed rate cut could affect a retirement-focused portfolio. ...
Every investor dreams of finding that next big stock before it takes off. The good news is that there’s a proven system that helps take a lot of the guesswork out of it.
The system I’m talking about? None other than William O’Neil’s methodology, developed after ...
As a StockCharts Member, you unlock all of our most powerful tools and features, including saved charts and settings, custom scans, technical alerts and much more. Discover all that StockCharts can do with our
free 1-month trial and start charting like a true market pro.