This past week was relatively calm, except for Tuesday’s wobble. However, the market recovered from that selloff slowly and steadily; for a minute, it looked like we might finish the week in record territory. Although that didn’t happen, the uptrend in the big three indexes remains intact. It felt as if the markets breathed a sigh of relief knowing September rate cuts were a reality, with additional cuts possible in October and December.
Overall, things wrapped up on a soft note. That's all the more reason to stick around and do a quick check-up on the week’s price action.
Looking at the Market Summary page, the Equities panel shows every major index trading above its 200-day Simple Moving Average (SMA). All, with the exception of Dow Utilities and Dow Transports, are trading above their 50- and 20-day SMAs.
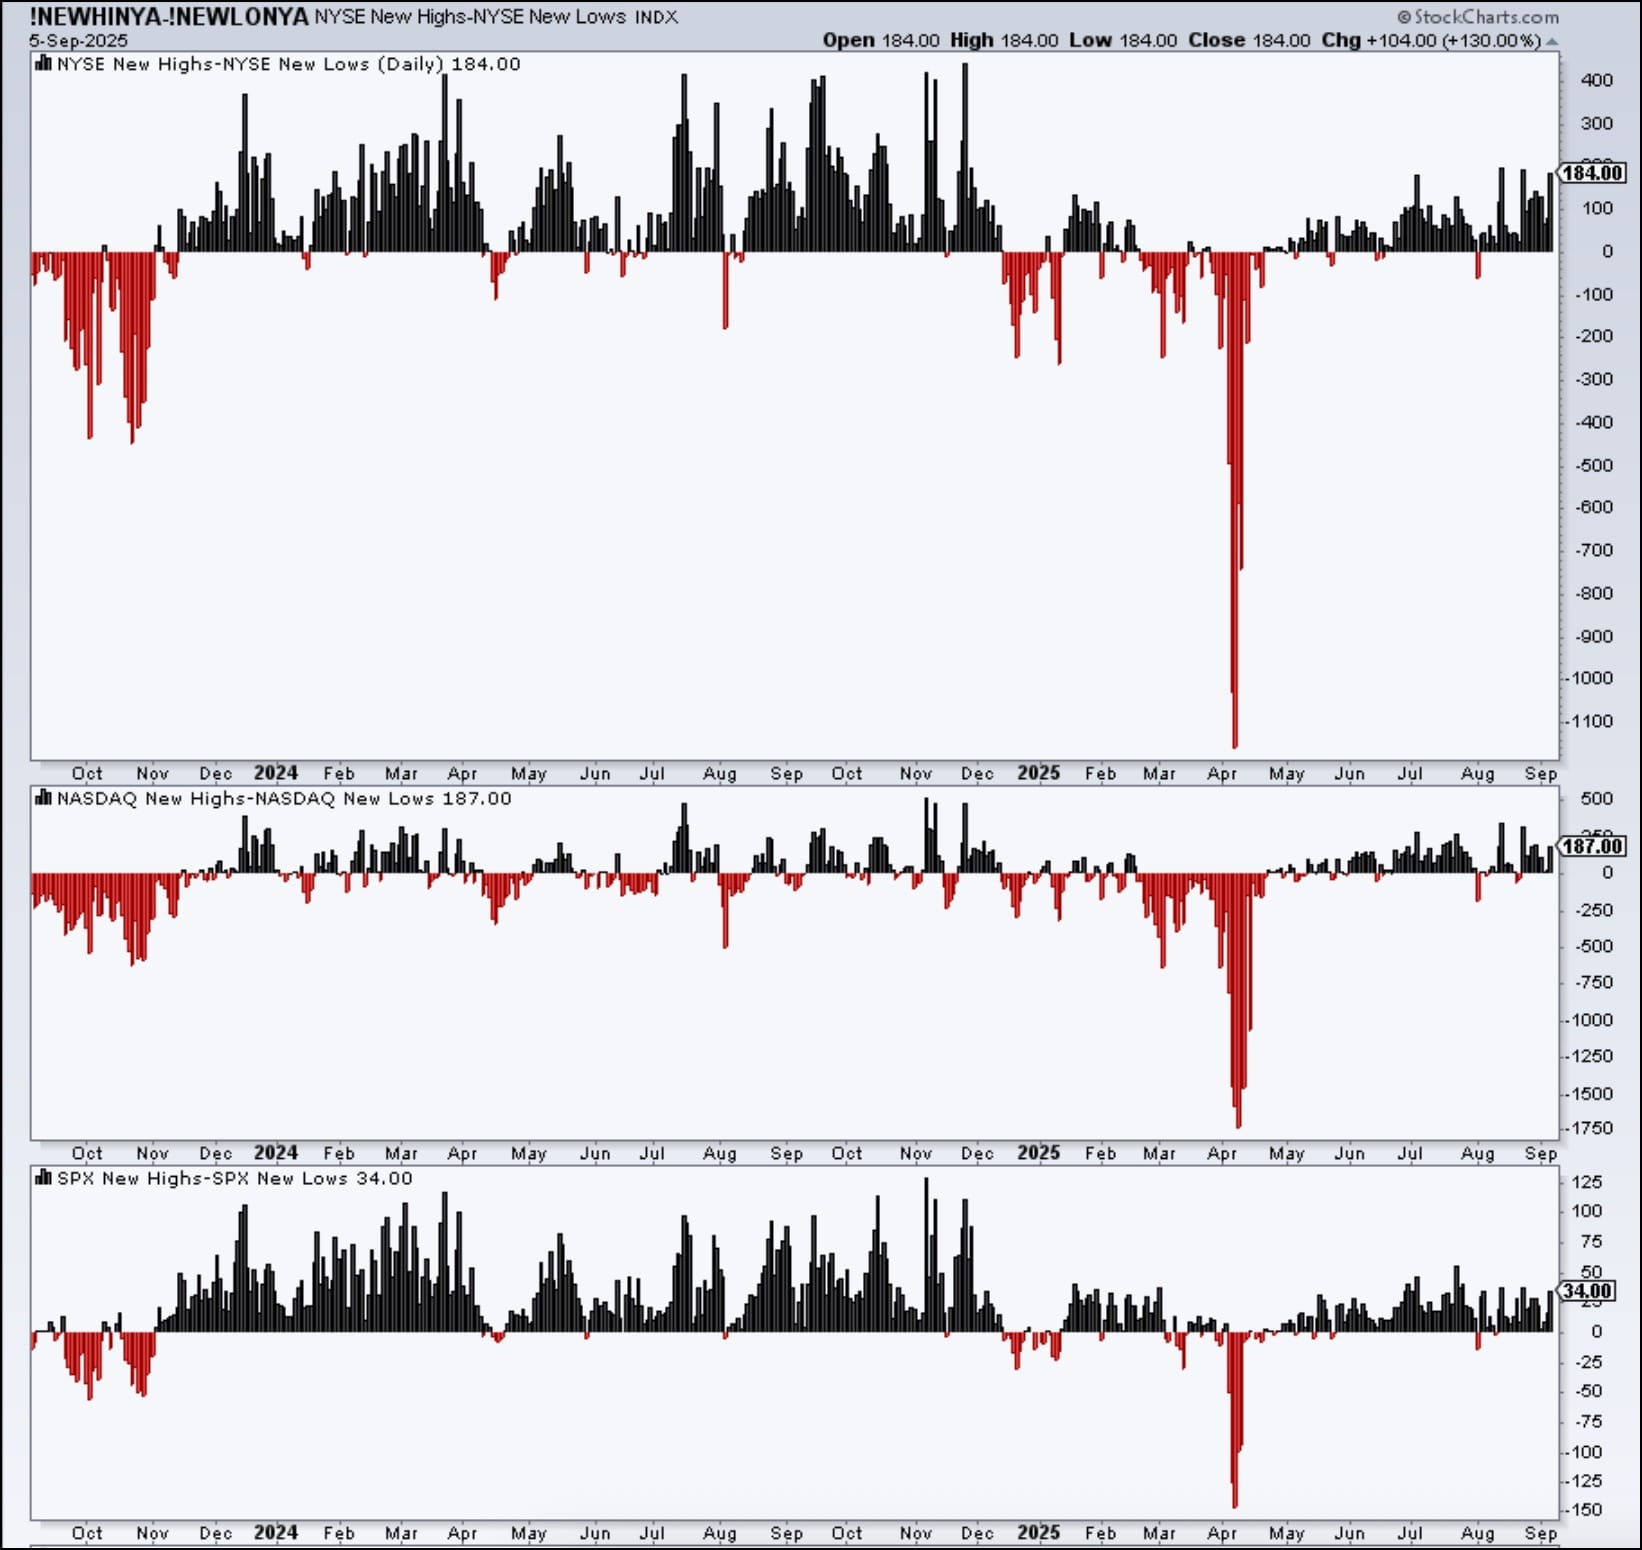
Market breadth looks healthy, as well; across the major indexes, new highs are outpacing new lows. The chart below shows the New Highs - New Lows for the NYSE, NASDAQ, and S&P 500. You can access the charts for the S&P Mid Cap, S&P Small Cap, Nasdaq 100, and the Dow by clicking the chart below or from the Charts tab in the New Highs panel in the Market Summary page.
What’s more interesting is that if you switch your timeframe from “Today” to “One Week” (top-left dropdown on the Market Summary page) and click the Size tab in the Key Ratios panel, you’ll see that mid-caps, small-caps, and micro-caps outperformed large-caps. That’s an indication the market is pricing in rate cuts this year.
Now that the rate cut uncertainty is in the rear-view mirror, does it mean we can expect an uneventful week ahead? Maybe, but it’ll come down to the inflation numbers. It would take a big surprise in the PPI and CPI to flip the market’s narrative. Be sure to monitor pre-market action on Wednesday and Thursday.
Dave explains how the 21-day exponential moving average can help confirm trend phases, validate signals from other moving averages, and serve as an essential risk management tool for traders. ...
This week, new highs are consistently outpacing new lows. The Communication Services sector is leading the pack, gold is surging, and there's a cybersecurity stock setting up for a big move. Read all about the stock market's price action here. ...
Back-to-back hammer candlesticks in the S&P 500 are sending a message. Here's what these signals mean, why the market feels stuck, and what investors should watch for next. ...
A plethora of breakouts suggests that international markets have much further to run on the upside. Martin reviews where the principal regions of the world currently stand. ...
As Broadcom surges following the announcement of a $10 billion AI chip deal, Mary Ellen breaks down AVGO's technicals and what makes it a market leader. ...
As a StockCharts Member, you unlock all of our most powerful tools and features, including saved charts and settings, custom scans, technical alerts and much more. Discover all that StockCharts can do with our
free 1-month trial and start charting like a true market pro.
With the "Earnings Calendar" on StockCharts, you can view results for companies that have recently reported quarterly earnings and stay ahead of upcoming earnings announcement dates. Visit StockCharts.com/earnings to see more.