|
This week's edition of The ChartWatchers Newsletter has arrived, featuring exclusive market analysis and technical commentary.
|
Hello, Fellow ChartWatchers!
Have you ever wished you could change any chart you open to appear just the way you want – in just a single click? With StyleButtons, you can do just that. Setting it upWhen you’re logged in to your StockCharts account and using SharpCharts, look at the upper-left of any chart. You’ll see a small gear (settings) icon, gray rectangles (your StyleButtons), and a plus (+) icon. - Open your chart and add the indicators, overlays, colors, etc., you like.
- Click the "+" icon to add a new StyleButton.
- In the pop-up, choose the button’s position, label, and color, then click "Save" to save the StyleButton.
- If you already have a default ChartStyle, assign a StyleButton to it. Now, just a single click will apply your default settings to any chart you open, including those in the Market Summary page.
💡 StockCharts tip: Since you can only apply two letters to your StyleButtons, make sure what those letters mean is obvious to you, such as DE for default, DA for daily, or W3 for a three-year weekly chart. And that’s not all!You can also use StyleButtons to switch time frames, such as: - Daily views for your routine checks.
- Weekly or monthly views to analyze longer-term trends.
- Intraday views to make entry and exit decisions.
Set each of these time frames as a StyleButton, and then move through them with one click per view. See it in actionClick here to watch how our Chief Strategist, Grayson Roze uses his StyleButtons for multi-time frame analysis on our StockChartsTV YouTube page. You can also check out our support page for how-to tips on managing your StyleButtons. And as always, you can catch up on market happenings from our articles and videos. Have a great weekend!
|
|
|
Sectors, How To, Market Analysis
|
|
by Julius de Kempenaer
|
|
|
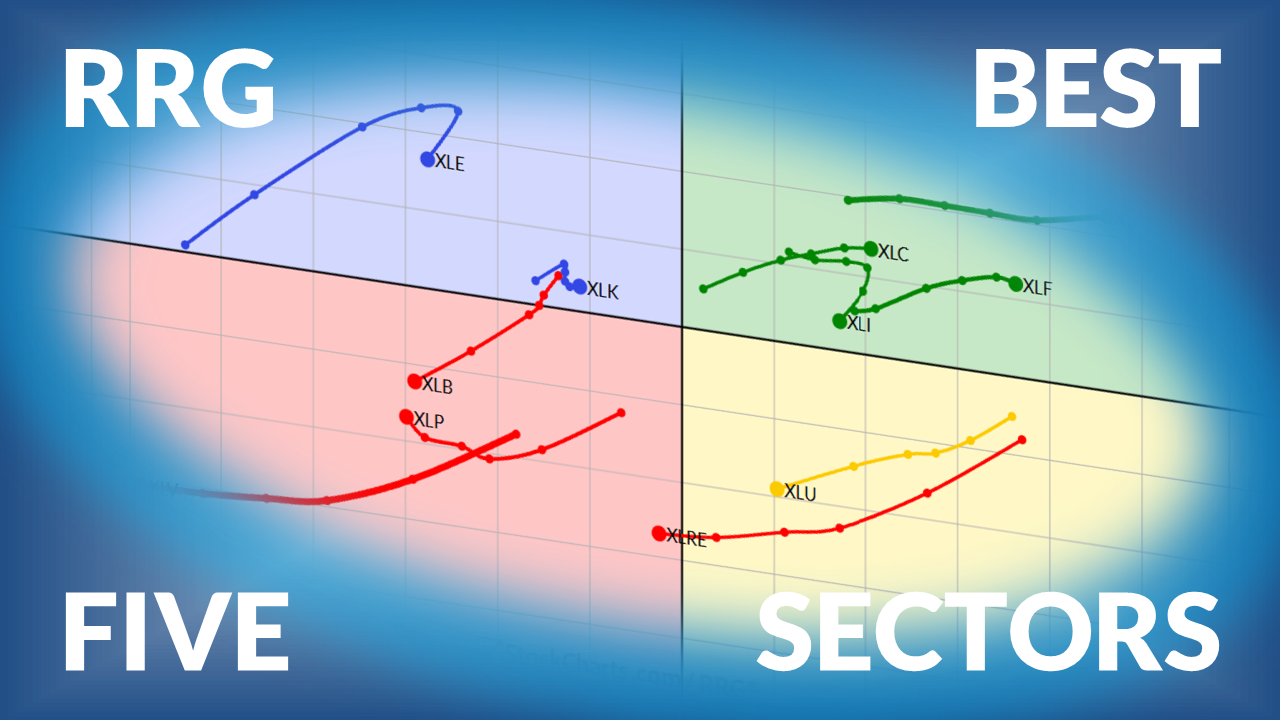
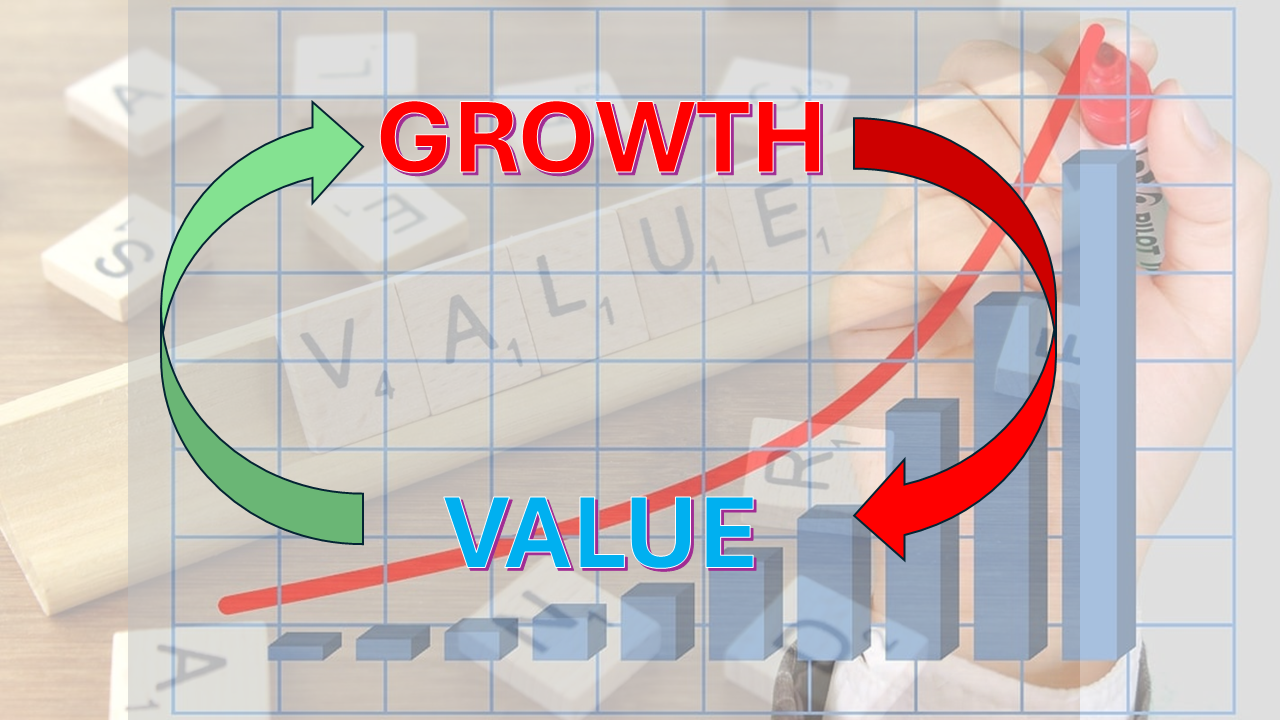
Growth and Value segments are widely used in the investment world, as investors shift from one to another based on market conditions and risk-appetite. Julius shows how to use Relative Rotation Graphs to help monitor these shifts. ...
|
|
Read More
|
|
|
Market Analysis, Equities
|

|
by Mary Ellen McGonagle
|
|
|
Mary Ellen looks back at winning stocks whose histories have been impacted by forward-thinking leadership and innovation. ...
|
|
Read More
|
|
|
Indicators, Market Analysis
|

|
by Frank Cappelleri
|
|
|
Despite skepticism, the S&P reached Frank's upside target of 6,555. Frank breaks down how we got here and what it means for ongoing market patterns. ...
|
|
Read More
|
|
|
Sectors, Market Analysis, Indicators
|

|
by Mike Zaccardi
|
|
|
With Industrials now in consolidation mode, Mike highlights underperforming single-stock culprits and explains why the groundwork is in place for a late-year rally. ...
|
|
Read More
|
|

|
| Smarter Investing Starts Here. |
|
As a StockCharts Member, you unlock all of our most powerful tools and features, including saved charts and settings, custom scans, technical alerts and much more. Discover all that StockCharts can do with our
free 1-month trial and start charting like a true market pro.
|
|
|
|
Learn More
|
|
|
|
ChartSchool
"Tip of the Week"
|
| With the "Earnings Calendar" on StockCharts, you can view results for companies that have recently reported quarterly earnings and stay ahead of upcoming earnings announcement dates. Visit StockCharts.com/earnings to see more. |
|
|
VISIT CHARTSCHOOL →
|
|
|
|