Another week, another round of fresh highs in the stock market, although the Nasdaq Composite ($COMPQ) wasn't able to hold on to its winning streak! Still, investor enthusiasm is high, and even a government shutdown isn’t slowing it down right now. What’s especially interesting is how strong August and September turned out. Those months are usually weak months for stocks, but this year they surprised us on the upside.
Historically, October leans positive, although we all know it’s had its fair share of big crashes. So far, though, there’s no sign of that happening. The major indexes are sitting comfortably above their 200-day moving averages – you can see this in the Market Summary page by checking the +/- SMA(200) column. And it’s not just in the U.S., as markets in Canada, Europe, and Asia are also feeling the optimism.
When markets feel stretched as they are now, it’s worth reminding yourself that momentum can shift quickly. One of the best ways to keep your finger on the market’s pulse is by watching breadth indicators.
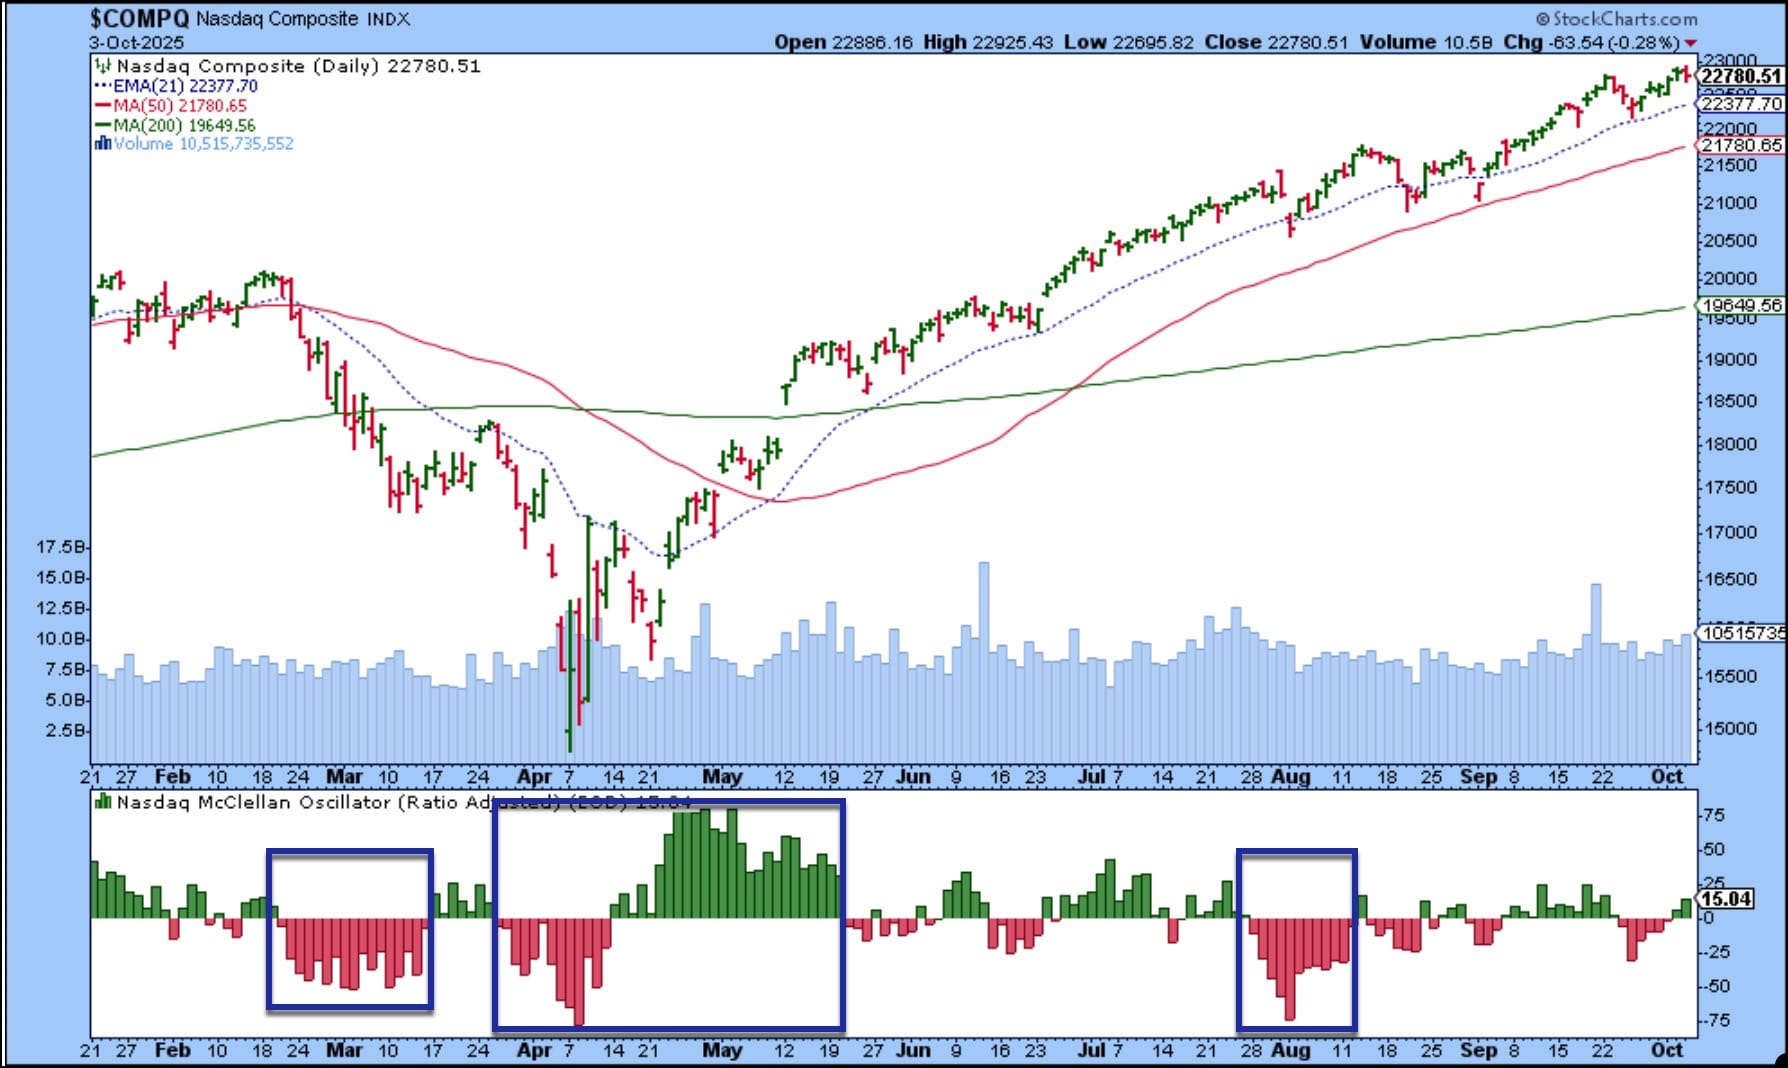
A great chart to add to your ChartLists is of the Nasdaq Composite ($COMPQ) with the NasdaqMcClellan Oscillator ($NAMO) plotted in the lower panel.
Why focus on the Nasdaq? Right now, the AI boom is fueling this rally, and if cracks appear, they’re most likely to show up in tech stocks first.
At the moment, $NAMO isn’t signaling extreme bullish or bearishness. It’s sitting in that “indecisive” zone.
If you go back to the end of February, you’ll notice a string of negative histogram bars when the Nasdaq was pulling back. This continued till mid-March, after which the oscillator remained indecisive for a few weeks. Then, after bumping into resistance on March 25, close to its 21-day Exponential Moving Average, the Nasdaq slid to its April low. During that time, $NAMO’s value sank to almost -80, a very bearish reading. Then, in late April, it surged to >+80, a breadth thrust that led to an extended rally. $NAMO displayed an indecisive period up until August, when it again fell to below -70. This coincided with the August 1 pullback, but the Nasdaq recovered, and $NAMO is once again looking indecisive.
Right now, there are no signs of extreme bullishness or bearishness. But if you start to notice a series of negative histogram bars forming again, consider it a cautionary signal and be prepared to tighten up your risk management.
The bottom line: Pullbacks or corrections are normal, healthy, and can even set up fresh buying opportunities. Stay alert, and never allow the market to make you feel complacent.
Before You Click Around…
Let’s be honest: most nav bars are just toolboxes. StockCharts’ new nav bar? It’s sleeker, smarter, and if you look closely, it’s also sneakier. Why? Hidden inside one of those tabs is a full-blown market analysis workflow. It’s a comprehensive top-down routine ...
Discover why the S&P 500 is at its most overvalued level in history. See earnings trends, valuation ranges, and what rising P/E ratios mean for investors heading into 2026. ...
As a StockCharts Member, you unlock all of our most powerful tools and features, including saved charts and settings, custom scans, technical alerts and much more. Discover all that StockCharts can do with our
free 1-month trial and start charting like a true market pro.