It was one of those weeks! The stock market traded in a relatively flat range, although there were a few bursts of volatility. Overall, things were relatively stable, with the broader indexes staying within last Friday’s trading range.
We did get a little bit of a scare on Thursday when “credit cockroaches” started crawling into the headlines. Fortunately, that concern faded almost as quickly as it appeared.
Here’s how the indexes wrapped up for the week.
Dow Jones Industrial Average ($INDU): 46190.61 (+1.56%)
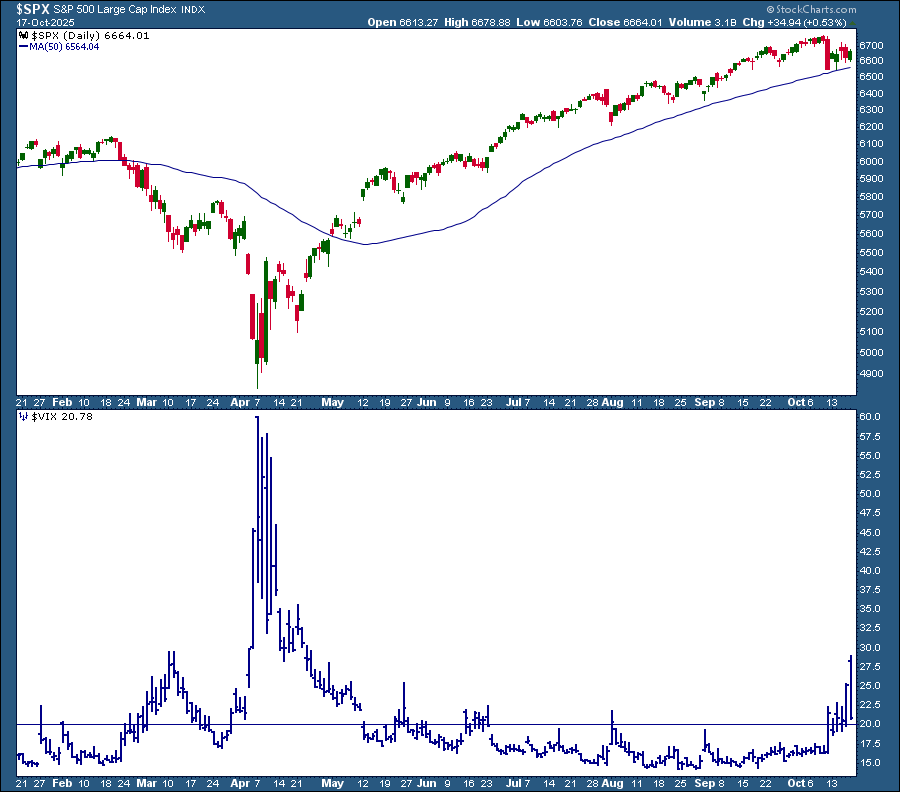
S&P 500 ($SPX): 6664.01 (+1.70%)
Nasdaq Composite ($COMPQ): 22679.97 (+2.14%)
Last week, we talked about the divergence between the S&P 500 and the NYSE Advance-Decline Line. That divergence remains in play (click here for chart).
Volatility creeps higher, but it’s not time to panic
This week, our attention turns to volatility. The Cboe Volatility Index ($VIX) popped above 20, a reminder that the market can and will surprise us. We’re nowhere near panic levels, but when the stock market is overstretched, it’s not surprising to see volatility spike. Investors get nervous and may be more inclined to sell rather than buy the dip.
The VIX flirted with 30 but eased back by Friday’s close. And to keep it in perspective, it’s still miles away from the +50 spike we saw during the April low. So while we are seeing some bumps, it’s not time to hit the panic button.
💡
StockCharts Tip: To see settings, click the above chart.
The good news is that the uptrend in the S&P 500 is still in play, and bank earnings have kicked off on a strong note. With more companies reporting in the coming weeks, there’s a lot to watch. You can keep up with it all by checking our Earnings Calendar.
Coming Up: Options Webinar You Won’t Want to Miss
🗓 October 1, at 12 PM EST
Join OptionsPlay for a special webinar, “How to Find High-Probability Reversal Trading Setups.” It’s open to all StockCharts members. Be sure to secure your spot by registering today.
Something fun for the weekend
If you’re in the mood for something lighter, tune into our latest StockCharts Game Show. It’s a fun, interactive way to test your market knowledge and enjoy a few laughs along the way.
Have a fantastic weekend, and for those celebrating, Happy Diwali!
The Hindenburg Omen is a macro technical indicator which was designed by reviewing the common characteristics of previous bull market tops. Dave breaks down the components of this indicator, reviews signals from the last 10 years, and discusses implications for the S&P 500 in Q4 2025. ...
Gold is completing multi-year consolidation or reversal patterns relative to different asset classes, setting the stage for significant breakouts. Here's an analysis of these different intermarket relationships. ...
Arthur Hill analyzes breadth in the Health Care, Financials, and Technology sectors. Which sectors are still in a long-term trend, and which are ready to break down? Find out here. ...
RSI readings, market breadth, and price patterns can provide directional signals for the stock market. Here's what you should monitor as the market goes through a relatively volatile period. ...
Micro-cap returns have outperformed those of the S&P 500 since the April low. Discover how you can capitalize on the micro-cap success if they continue their upward trajectory. ...
Before We Dive In…
Finding an “edge” in the markets can mean looking at tools that most overlook, or using a seemingly “common” tool from an uncommon angle. The ZigZag is a perfect example. It’s not the most popular tool. It’s not even an indicator. Yet it has ...
As a StockCharts Member, you unlock all of our most powerful tools and features, including saved charts and settings, custom scans, technical alerts and much more. Discover all that StockCharts can do with our
free 1-month trial and start charting like a true market pro.
On our "Symbol Summary" page, you can read brief company descriptions to help you learn more about the stocks you're following. Look for the Profile section of the Symbol Summary.