After taking a little breather, the market is back to setting new records. The Dow just topped 47,000 for the first time, and the S&P 500 and Nasdaq weren’t slackers either.
Here’s how the major indexes wrapped up the week.
Dow Jones Industrial Average ($INDU): 47,207 (+2.20%)
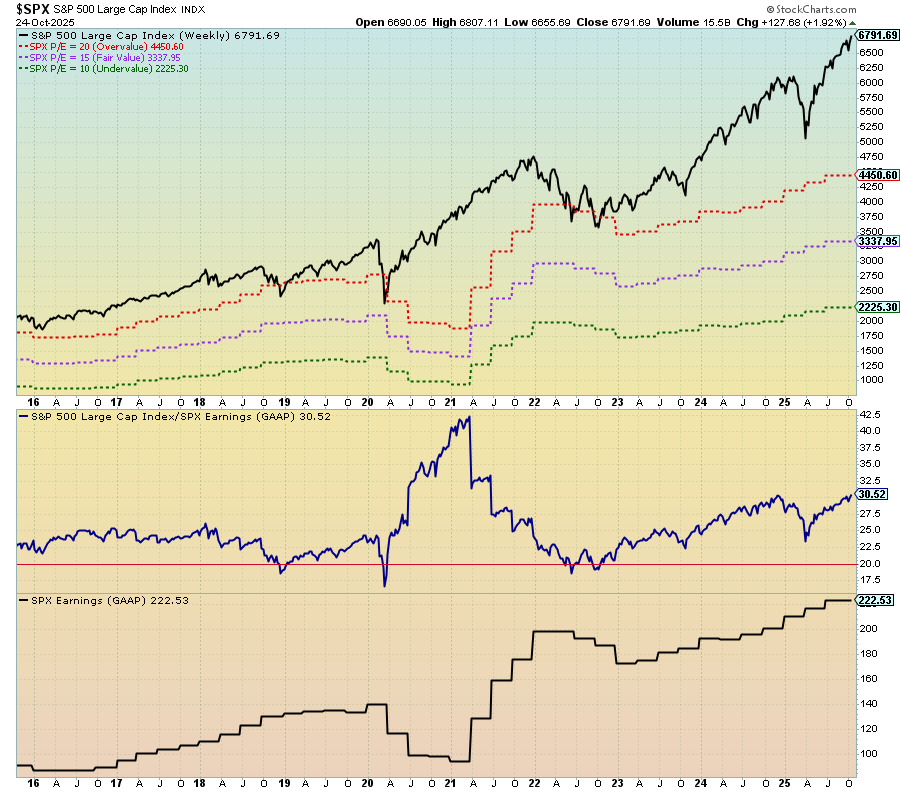
S&P 500 ($SPX): 6,791.69 (+1.92%)
Nasdaq Composite ($COMPQ): 23,204.87 (+2.31%)
Next week should be an eventful one with a Fed meeting and big tech earnings. You can stay on top of all the earnings action using our Earnings Calendar. So far, things have been healthy, as seen in the earnings chart below.
Earnings continue to trend above average, and companies are reporting stronger numbers for Q3. If big tech follows the trend, the market could get another boost. The downside is that the S&P 500 is looking pretty stretched, which means we’ll want to keep a close eye on the market’s action.
💡
StockCharts Tip: Click the chart to see settings.
An overvalued market can be volatile, which means that during selloffs, stock prices can go down faster than they go up. In a headline-driven market, any negative news can make investors jittery. So far, we’ve had some pullbacks, the most notable being in April, but the market has proven resilient. Stocks have bounced back. Market breadth is in favor of the bulls, and investor sentiment is turning optimistic.
If you’re following the action, now’s a good time to keep tabs on the overall trend. A quick glance at daily and weekly charts can tell you a lot. Are prices holding above key moving averages? Are those averages trending higher? It’s generally a good sign when the 50-day is above the 100-day, and the 100-day is above the 200-day.
Join Chief Market Strategist Tom Bowley for an in-depth look at what’s driving the market higher and what to watch for as we close out the year. Tom will break down the connections between interest rates, earnings, and price action, plus share ideas for positioning through earnings season volatility.
Can’t make it live? No problem. Register for the event, and EarningsBeats.com will send you a replay.
In a bullish market environment, with the technology sector leading the way and cybersecurity stocks in an uptrend, Arthur presents a couple of stocks that may be poised to break out. ...
Technical analysis is about having a consistent process of evaluating the evidence. Dave revisits three charts he highlighted at the end of September, reviews how the technical picture has changed, and updates his thesis using price and momentum techniques. ...
Blue-chip stocks have performed well as Q3 earnings kick into high gear. Learn how the absolute and relative strength of the Dow Jones Industrial Average can offer clues about market direction. ...
Falling U.S. Treasury yields have contributed to the bullish rally in equities. Here's an analysis of how the bull market can help identify leading industry groups and the stocks that lead the groups. ...
Before We Dive In…
You’re about to learn something unique: how to gauge trend strength and seize market opportunities using two sets of eyes. The GMMA splits price action into short-term and long-term views, giving you two perspectives on the same market. With one eye on fast-money moves and ...
As a StockCharts Member, you unlock all of our most powerful tools and features, including saved charts and settings, custom scans, technical alerts and much more. Discover all that StockCharts can do with our
free 1-month trial and start charting like a true market pro.