This past week kept investors on their toes! The Fed meeting came and went without giving much confidence that we’ll see another rate cut in December. And right on its heels came a flurry of big tech company earnings — Alphabet (GOOGL), Meta Platforms (META), Microsoft (MSFT), Amazon (AMZN), and Apple (AAPL).
For the most part, the numbers looked good as most companies beat estimates. Judging by how their stocks behaved, though, the results may not have wowed investors. GOOGL and AMZN held up well, while others were more mixed. META took the biggest hit after missing its EPS estimates, as the stock fell more than 11% and slipped below its 200-day moving average. Did it deserve that steep drop? Maybe not, but in a stretched market, even slightly disappointing earnings can trigger an outsized reaction.
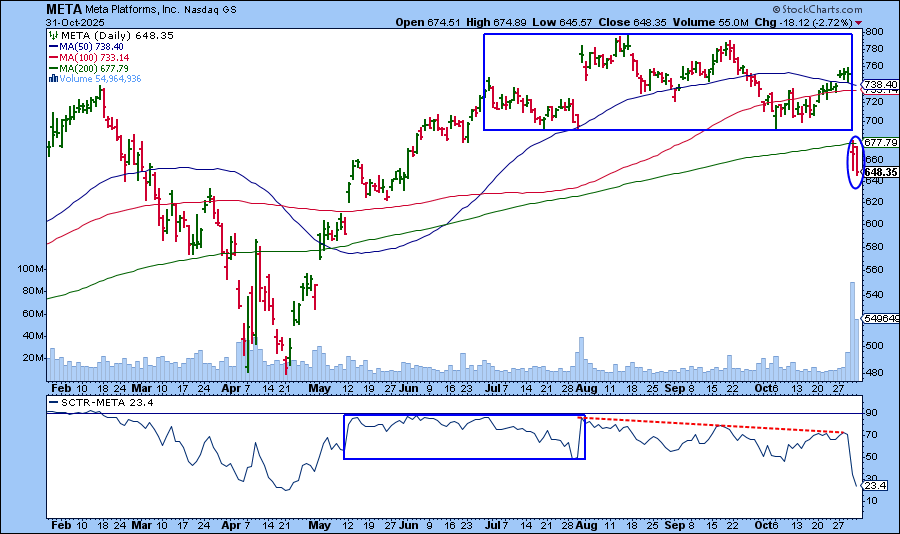
Take a look at META’s chart. After rallying strongly from its April low, the stock started to stall in July, popped higher, and then went sideways until its earnings announcement.
Even though the moving averages (50-, 100-, and 200-day SMAs) are still stacked in bullish order, the 50-day SMA has turned lower and looks like it’s getting ready to cross below the 100-day SMA. This is an indication that the uptrend is losing strength. Another interesting point is that during META’s big move from April to August, the StockCharts Technical Rank (SCTR) score didn’t exceed 90 (see lower panel), and since August, it has trended lower.
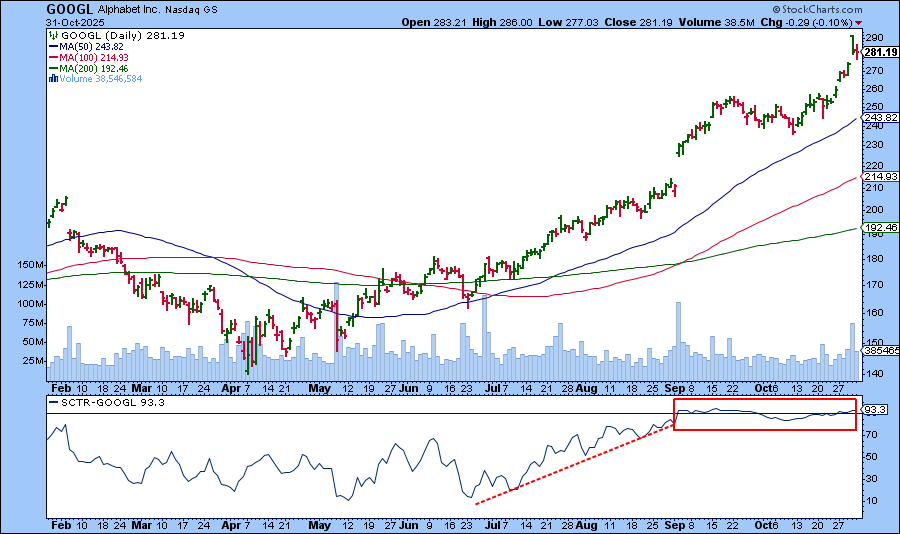
Now let's compare META’s chart with GOOGL’s.
After its earnings announcement, GOOGL’s stock price jumped sharply. The 50-day SMA is trending higher, a sign the stock is still in a strong uptrend. Its SCTR score rose from June and crossed above 90 in September. From there, it moved sideways for a while, dipped slightly in October, and is now back above 90. Technically, GOOGL was the stronger stock, and its post-earnings performance may continue to outshine META’s.
Buying a stock right before an earnings announcement is always a gamble. The stock price could swing either way, sometimes drastically. Applying indicators such as SCTR can keep you stay one step ahead.
📈
Have some fun with your charts: Head over to our Earnings Calendar and find a few actively traded stocks of companies announcing earnings next week. Pop those symbols in the chart (you can click on either of the charts above to access the live versions), check their trends and SCTR scores. Then see how the stocks move after the earnings announcements.
Enjoy the process and have a fun, relaxing weekend!
As the Magnificent 7 dictate the tone for the S&P 500, their charts reveal early signs of fatigue amid mixed earnings reactions. Technical discipline remains essential as investors assess whether these former leaders can sustain their uptrends into year-end. ...
NVIDIA shares reached a record $5 trillion in market cap. Here's a deep dive into the stock's price action and what could keep it in the driver's seat. ...
With U.S.-China trade talks on the immediate horizon, Martin Pring takes a look at commodities poised to benefit. He also presents an update on $GOLD. ...
The primary driving forces in the stock market are the QQQ and key mega-cap companies. In this article, Arthur Hill shares his insights and observations on the technical price action in the Mag7 ETF and QQQ. ...
Before We Dive In…
For every story a chart tells, there are stories hidden from plain view. One story tends to repeat itself almost like clockwork, though it also comes with variations. That’s what seasonality is all about: odd months where stocks tend to shine, stumble, or stall. In ...
Dave Keller explores the classic head and shoulders top, breaking down its three key phases with examples from JNJ and Dominion, plus a failed pattern in Nucor that turned into a bullish reversal. ...
As a StockCharts Member, you unlock all of our most powerful tools and features, including saved charts and settings, custom scans, technical alerts and much more. Discover all that StockCharts can do with our
free 1-month trial and start charting like a true market pro.