Tech stocks are tumbling. The AI rally just slammed the brakes. Investors are getting fearful. This week's headlines painted a picture of panic, but beneath the surface, something else may be unfolding.
When the stock market is overstretched, it’s not unusual for it to pull back. We’ve seen this play out several times this year. Each time the market pulled back, buyers would jump back in and send the market higher. This week felt a little different, though. Buyers weren’t rushing back in right away, and for a moment, it looked like the major indexes might end the week below some key support levels.
Then, midday on Friday, the broader indexes started to perk up and, by the closing bell, a couple of them closed higher.
Here’s how the indexes finished on Friday.
Dow Jones Industrial Average ($INDU): 46,987.10 (+0.16%)
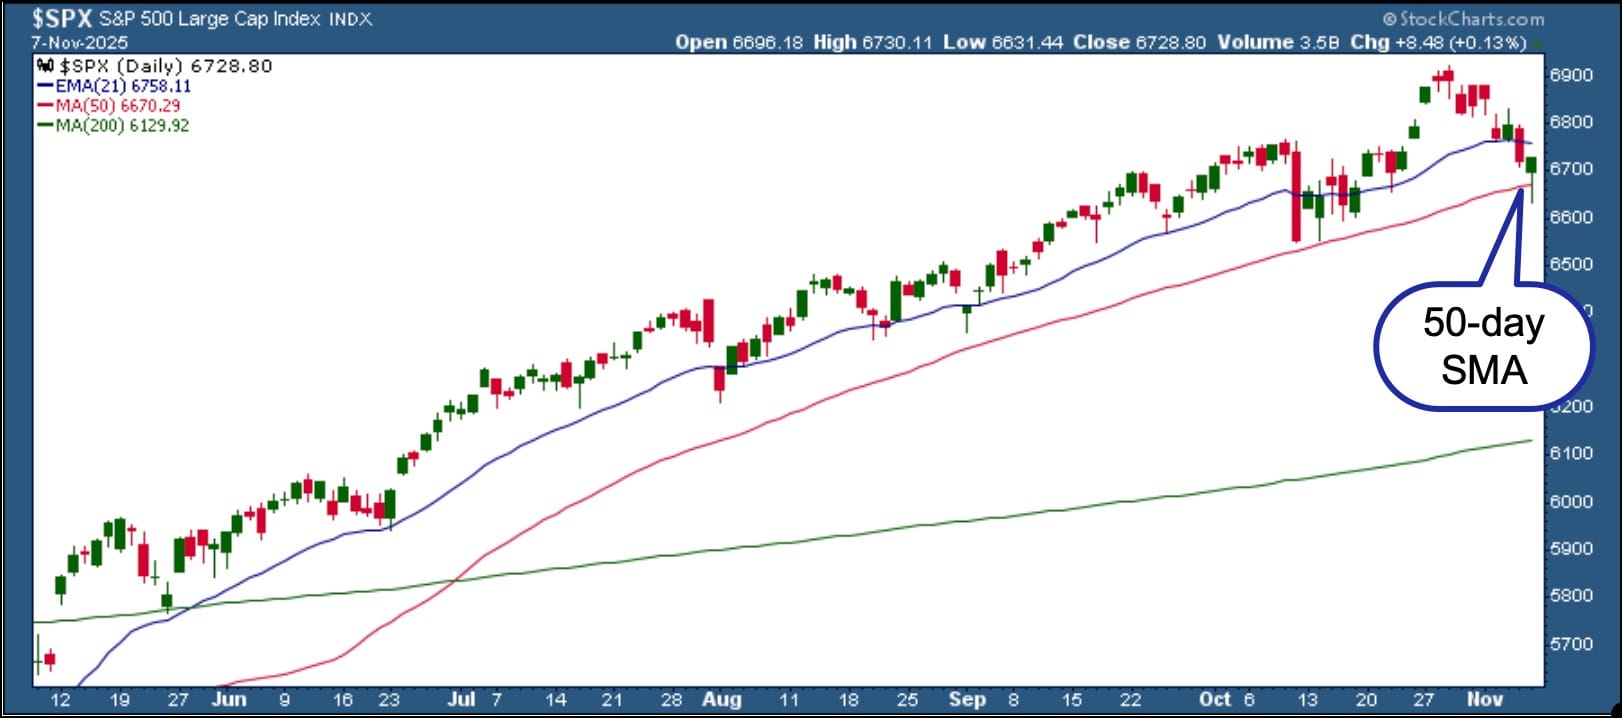
S&P 500 ($SPX): 6,728.80 (+0.13%)
Nasdaq Composite ($COMPQ): 23,004.54 (-0.21%)
If you were to pull up a daily chart of these indexes, you’ll see they’re all holding on to key support levels — the 50-day simple moving average (SMA) for the S&P 500 (see chart below) and Nasdaq Composite, and the 21-day EMA for the Dow. Even the Cboe Volatility Index ($VIX), which briefly jumped above 20, settled back below that level by the end of the week.
Despite all the chatter about fear and volatility, the big picture looks healthy. What we’re seeing now may be a much-needed correction that gives the market a chance to catch its breath before the next leg higher.
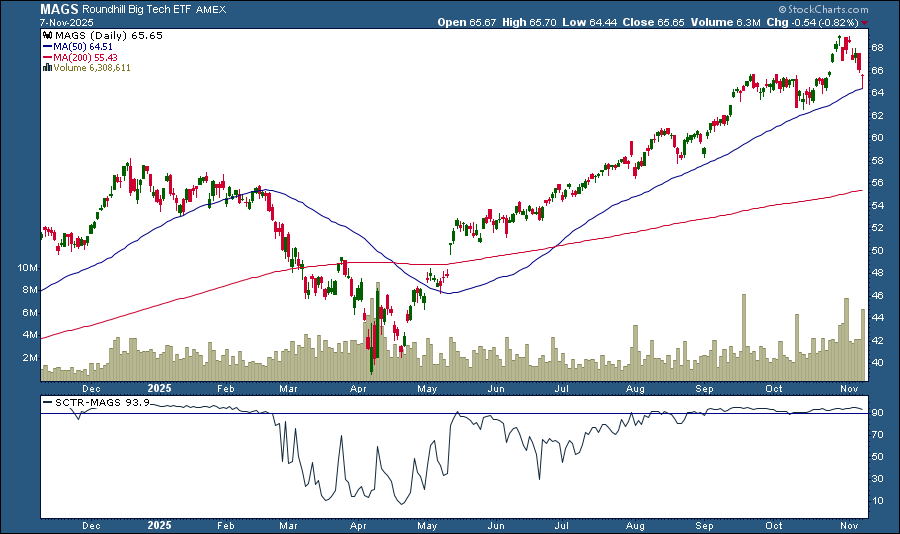
The Mag 7 stocks have been heavy contributors to the market's upward move. If you take a look at the chart of the Roundhill Big Tech ETF (MAGS), you’ll see it bounced off its 50-day SMA. The StockCharts Technical Rank (SCTR) score in the lower panel is close to 94, signaling continued technical strength.
💡
What’s the SCTR score for stocks and ETFs in your portfolio? Click on the above chart and experiment a bit. Enter different ticker symbols and identify trend direction and the SCTR score, two items (among several others) that should be on your checklist.
Bottom line: Markets can’t go straight up forever. Periodic pullbacks help bring valuations closer to reality and often set the stage for the next rally. This could be one of those times.
You’ll find more perspectives like this in our latest collection of articles and videos, including a special new release from Larry Williams, who shares where he sees potential risks and opportunities building across the market.
🗓️Mark Your Calendars!
Saturday, November 15, 10:00 AM ET — Our friends at EarningsBeats.com are hosting a Fantasy Stock Draft featuring Tom Bowley, Grayson Roze, and Julius de Kempenaer. Watch them go head-to-head with their stock picks. Who scores big and who gets benched? You’ll have to tune in to find out.
The S&P 500 has broken below its 21-day EMA and key trend channel support, testing its 50-day moving average as market breadth weakens. With tech leaders like NVDA and AVGO tumbling, investors should watch for a possible rotation toward defensive sectors. ...
Technology stocks may be selling off, but money is rotating into other areas. Check out the charts of the industry groups that are indicating upside breakouts. ...
Arthur Hill analyzes the performance of the Health Care sector relative to other S&P 500 sectors. Find out why Health Care shows promise as we head into the end of the year. ...
Intermarket relationships between stocks, bonds, the US dollar, and commodities are unsettled at the moment. What happens next? Here are the charts investors should be watching for clues. ...
Has the rotation into Tech peaked? Or is this just a pause within a longer-term leadership trend? Mary Ellen explores with a look at the sector chart and an individual stock. ...
As a StockCharts Member, you unlock all of our most powerful tools and features, including saved charts and settings, custom scans, technical alerts and much more. Discover all that StockCharts can do with our
free 1-month trial and start charting like a true market pro.