When you get used to a resilient stock market, it can feel a little disorienting when things suddenly start to zig instead of zag. We got a taste of that this week, as some days the market marched higher, and other days it sold off sharply. If you felt like you were on an emotional roller coaster, you’re not alone. And yet, after all that drama, the market ended up pretty much where it was last Friday.
During weeks like this, it’s best not to let the market wear you down. Instead, carve out some time this weekend to step back and look at things with a clear head. The Market Summary page is perfect for that, giving you a big-picture look at the major indexes so you can see what’s really happening beneath the noise. For example, the U.S. market may have been choppy this week, but how did the rest of the world hold up?
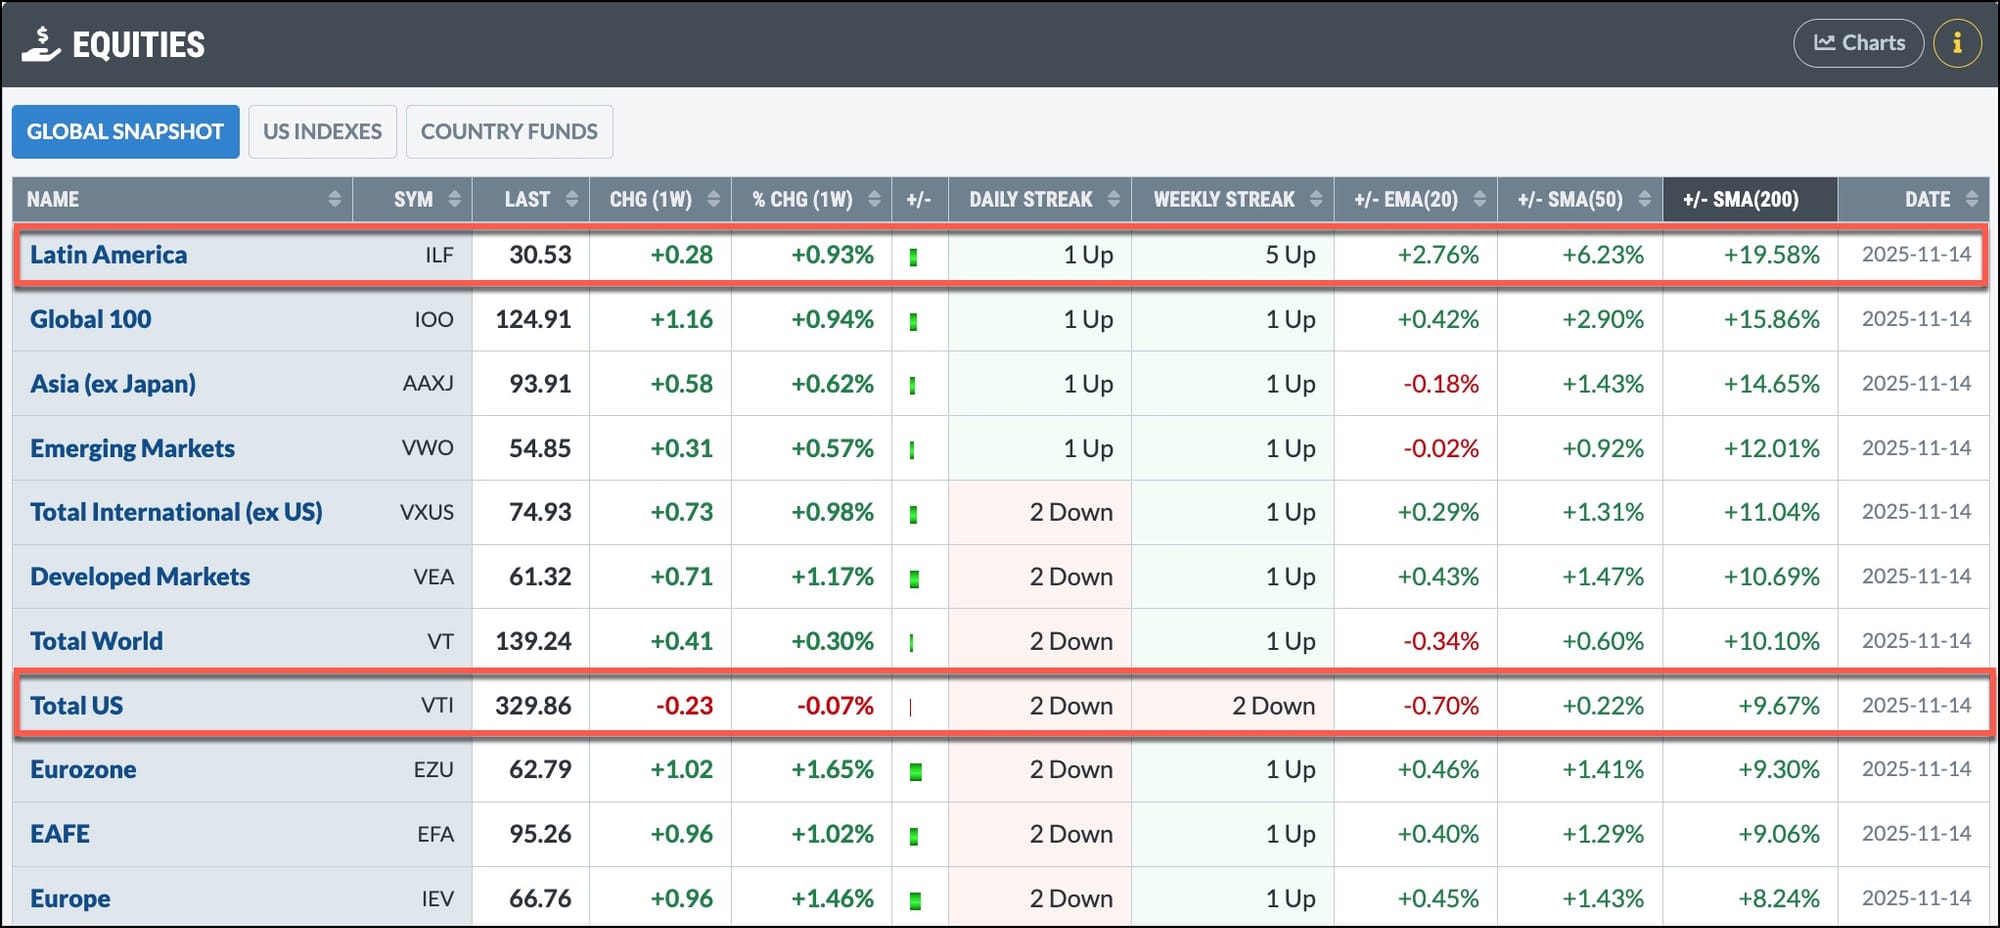
On the Market Summary page, click the Global Snapshot tab in the Equities panel. I like to start by sorting the list by the +/- SMA (200) column.
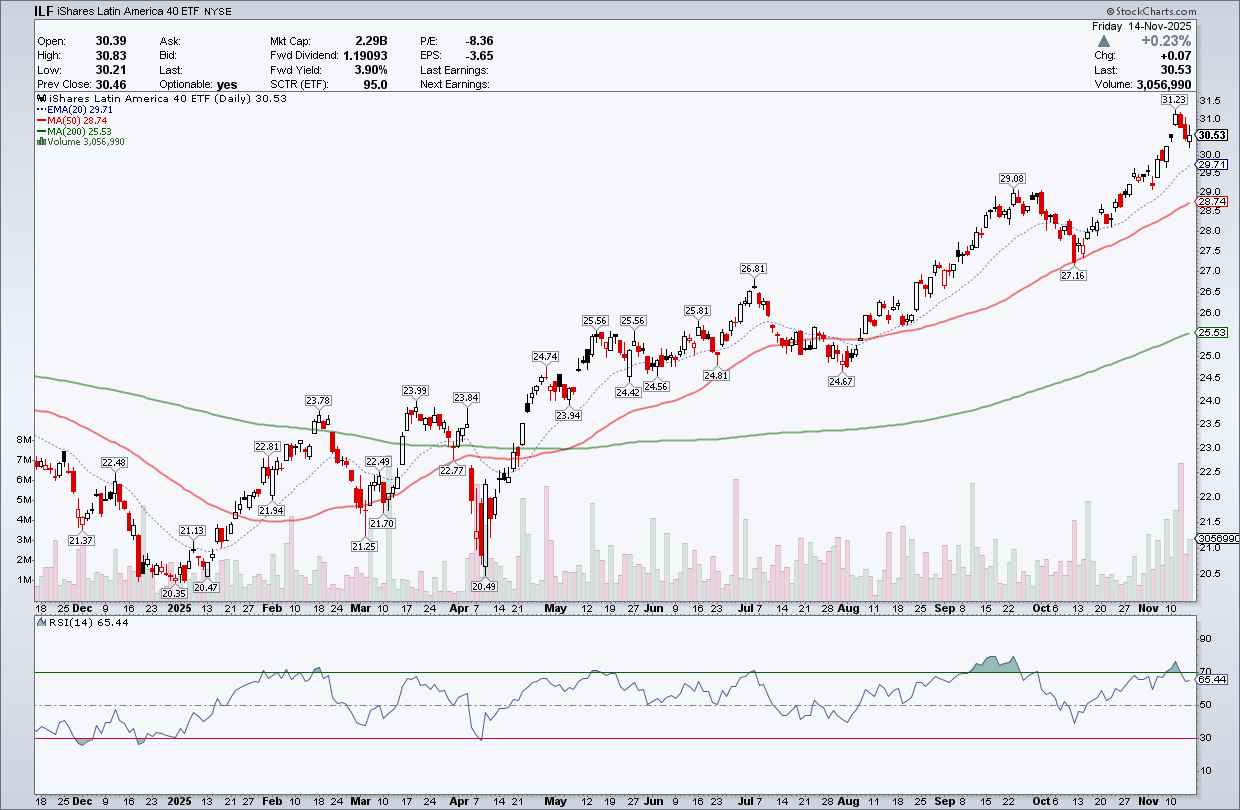
One thing that caught my eye was that Latin America grabbed the top spot and logged five straight up weeks. That definitely called for a close look, and, sure enough, the iShares Latin America 40 ETF (ILF) has been trending steadily higher since April 9.
Meanwhile, the U.S. market landed much lower on the list. Perhaps the absence of economic data and fading expectations of a December interest rate cut may be cooling things down a bit here at home.
Since the Market Summary page focuses primarily on the U.S. market, it’s a great way to check in on market internals such as breadth, sentiment, and the market’s overall personality. Do you see anything that suggests the bears are starting to gain control of the market?
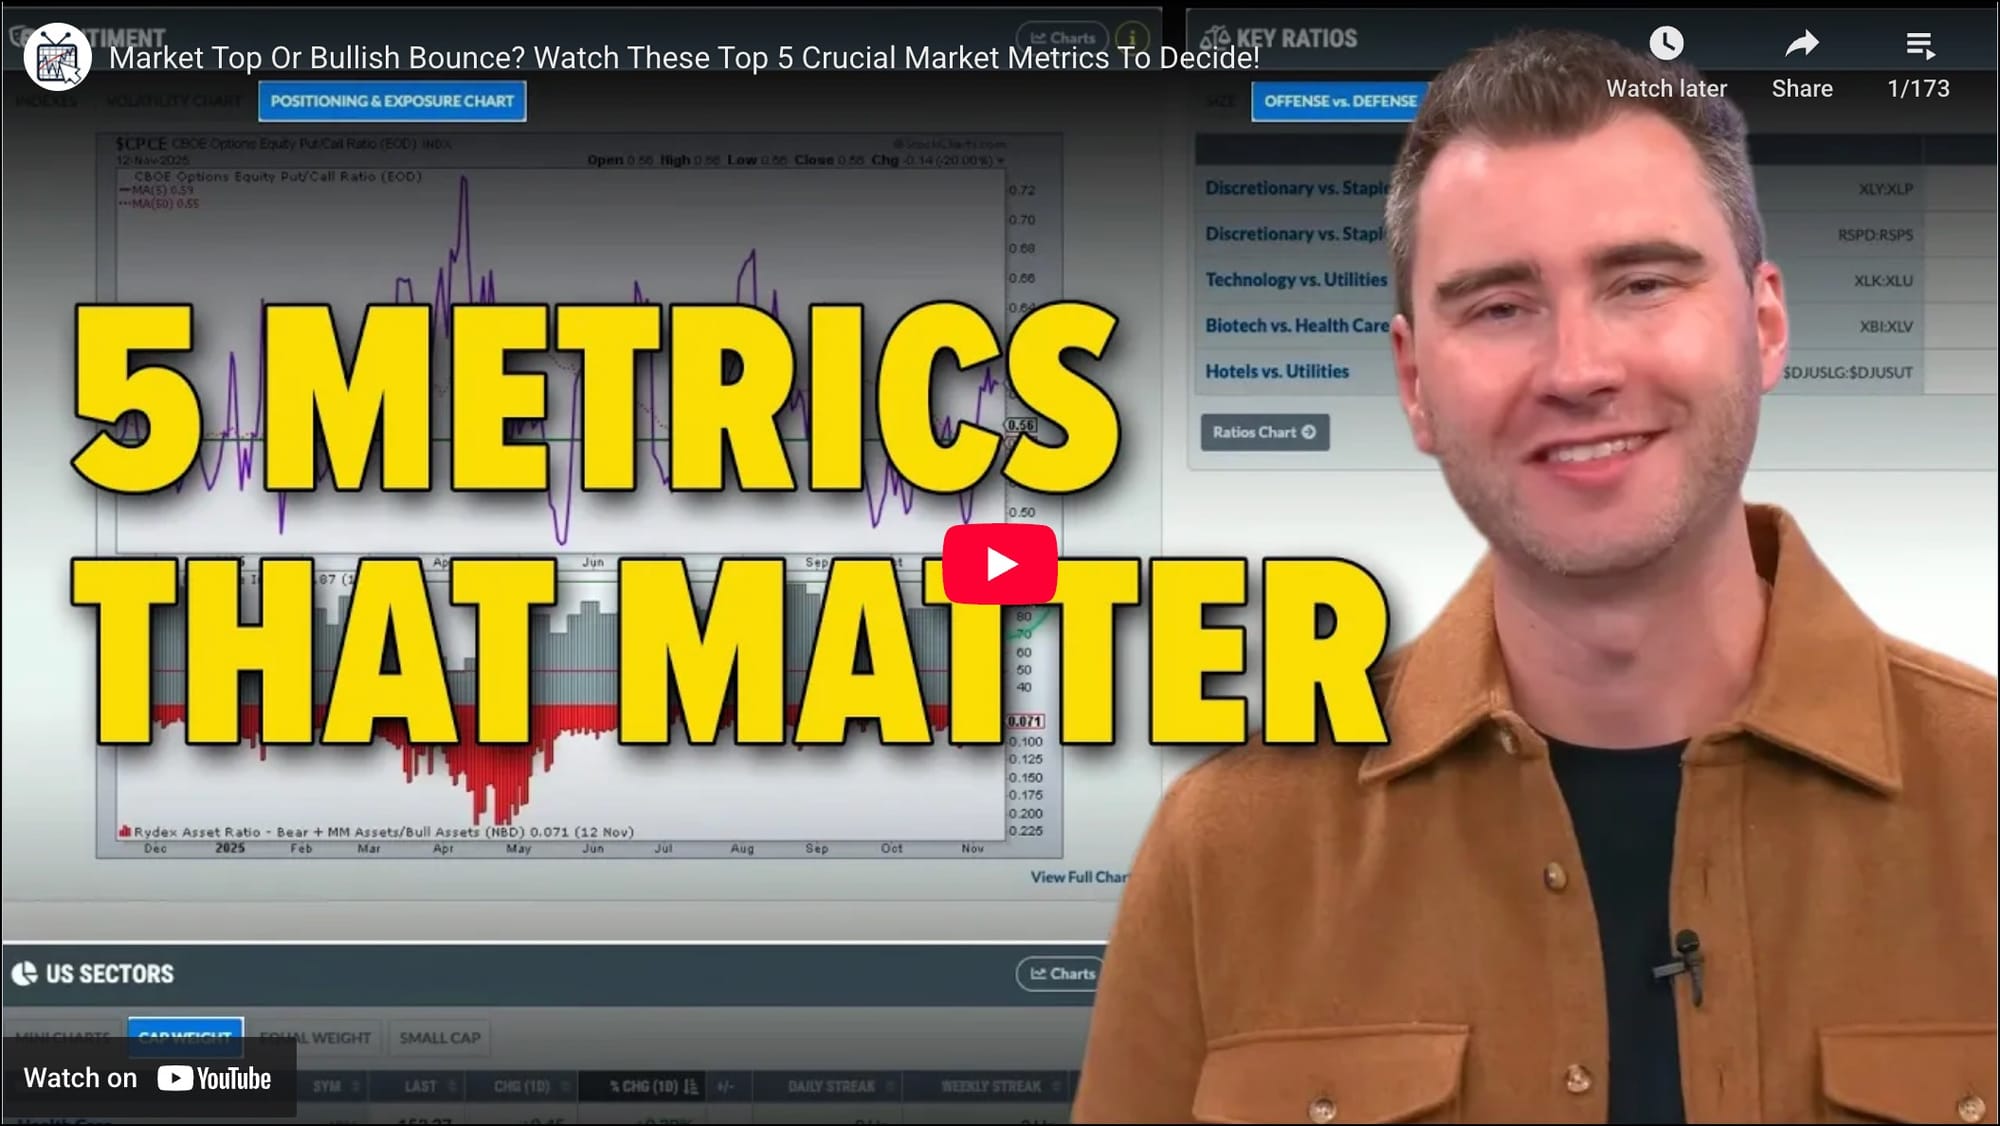
Before you dive in, I highly recommend watching this video. Grayson Roze, our Chief Strategist, walks you through the top five market metrics he keeps an eye on. Plus, he throws in a bonus chart for good measure. So grab your favorite beverage, sit back, and follow along. Who knows? You might spot something even Grayson didn’t mention.
The market is an unpredictable beast. The better you get to know it, the more likely you are to spot the warning signs before they matter.
💡
StockCharts Tip. Download the Market Summary ChartPack to access 31 ChartLists of pre-formatted charts from the Market Summary page.
We’ve got a lot happening this week.
The Fantasy Stock Draft is coming up!
Make sure to register for this free event. Watch Tom Bowley, Grayson Roze, Julius de Kempenaer, and a mystery guest go head-to-head.
Saturday, November 15, 10:00 AM ET
And if you haven’t already …
Sign up to be notified of our Cyber Week sale, which kicks off on November 24. It will be for a limited time, and it’s the biggest sale we’ve ever had.
The stock market churned but went nowhere this week as breadth held steady and rate-cut odds shifted. Here's what investors should watch next week. ...
Small-cap stocks have broken below a key support level. Volatility is also creeping higher. Tom Bowley shares his views by breaking down several charts. ...
When technology ETFs are breaking down, insurance stocks and bonds are showing strength, and Bitcoin is triggering a downtrend, it means the stock market is showing signs of risk aversion. Arthur Hill analyzes charts of these asset groups and identifies the signals they are sending. ...
Commodities are making a bullish run in a seasonally weak period. Keep an eye on this potentially leggy asset class and find out how you can take advantage of the commodity run. ...
With talk of tariffs being rolled back, stocks like Best Buy, Stanley Black & Decker, and Nike could benefit from renewed optimism. But, as Dave, explains, the charts tell the real story, revealing which names are technically ready to lead the next move higher. ...
Martin Pring walks you through a chart arrangement that identifies stocks with a high probability of trending higher. Find out how he scans for the long-term trend using absolute and relative prices. ...
While the stock market indexes are looking range-bound, there's a shift in what's driving the market's performance. Find out what's going on beneath the surface. ...
Before We Dive In…
Markets change. Principles don’t. More specifically, the way we deal with markets evolves, but the factors driving markets remain consistent. Famed technical analyst John Murphy distills these factors into 10 Laws. These are timeless lessons that cut through the market noise and reveal how price, ...
As a StockCharts Member, you unlock all of our most powerful tools and features, including saved charts and settings, custom scans, technical alerts and much more. Discover all that StockCharts can do with our
free 1-month trial and start charting like a true market pro.