If this market didn’t make you feel dizzy, you’re in rare company. After a week like this, most of us could use a moment to catch our breath and get our bearings.
So, instead of loading you up with charts today (okay… maybe just one), I wanted to give you a quick heads-up about something happening next week.
Starting Monday, we’re kicking off our Cyber Week sale. It’s the one time of year when we offer our six and 12-month subscription plans at a steep discount. Long-time StockCharts members know now is the right time to lock in some savings and, if you’re new around here, you’re just as welcome to take advantage.
For those who are already StockCharts members, here’s an easy bit of prep for you to do.
Log in, click your name in the top-right corner, and select Your Account.
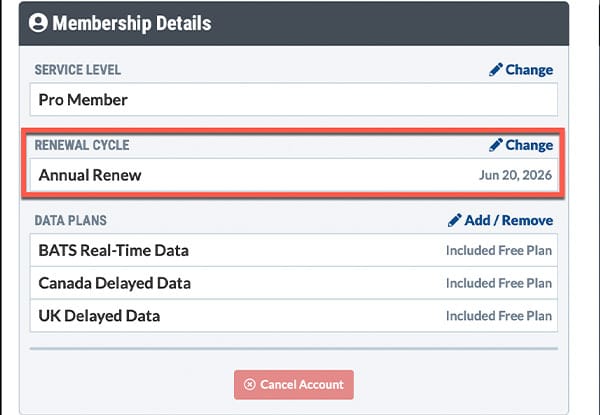
Under Membership Details, you’ll see when your current plan renews.
Knowing that date will help you see how much extra time you’d gain by picking up a discounted plan during Cyber Week. Yes, your new term simply gets added on top of whatever you have left.
Here are some examples.
Imagine not having to think about renewals for another six or 12 months. That leaves more mental space for the fun stuff, like figuring out the chart below.
Guess the chart
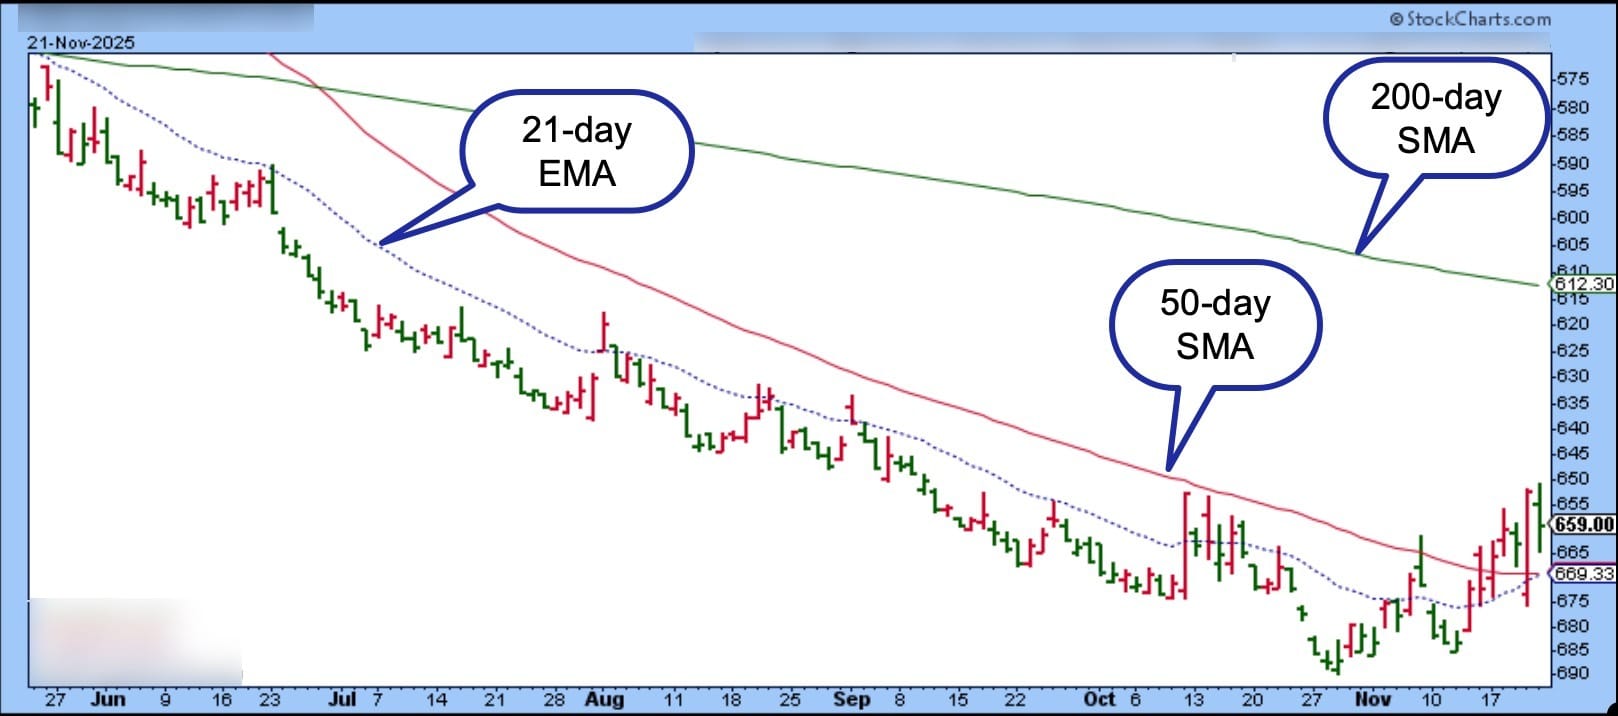
It’s a little sneaky, and the price data may give it away. But, give it a whirl before scrolling down for the answer.
Answer:
It’s an inverted chart of SPY. When the market is selling off and you’re weighing whether to step back in, flipping a chart upside down can give you a fresh perspective on potential entry points. Is now the moment? That really depends on your own criteria, because things look a little different upside down.
💡
StockCharts Tip: In SharpCharts, just check the Invert Main Price Scale box in the Scale & Display Settings to see an inverted chart.
This is just one of many tools tucked inside StockCharts. If you’ve been meaning to explore more or simply want to lock in a longer subscription at a friendlier price, Monday’s a great time to do it.
Have a wonderful weekend, and here’s to calmer markets ahead!
A “change of character” is emerging as major indexes weaken in November. Equal-weight indexes confirm a bearish turn, Bitcoin’s collapse highlights fading speculation, and the S&P 500’s key support near 6550 may be the final line before a deeper market correction. ...
There's a lot of noise in the market right now, but the longer-term perspective shows the major indexes testing key support levels. Investor sentiment may also be shifting. What could lie ahead? Take a look at these charts. ...
Healthcare, consumer staples, and gold stocks continue to hold steady while speculative tech names are flashing bearish signals. Get a closer look at the different sectors and one stock that looks like it's ready to trend higher. ...
Consumer Discretionary and Consumer Staples are lagging the most in sector performance. Costco's chart could send an early warning signal in consumer sentiment. ...
Before We Dive In…
While the tools and strategies we use to analyze markets have evolved, human behavior has remained consistent (more or less). That’s why John Murphy’s Ten Laws of Technical Trading is as relevant today as it was during the long course of history from which ...
As a StockCharts Member, you unlock all of our most powerful tools and features, including saved charts and settings, custom scans, technical alerts and much more. Discover all that StockCharts can do with our
free 1-month trial and start charting like a true market pro.