It was a relatively quiet week in the market, with the major indexes barely budging. That’s not a bad thing. It's the perfect backdrop to do some planning.
With 2026 around the corner, now’s a great time to look back on 2025 and ask yourself a few honest questions:
What do you wish you had done differently?
What were your most profitable investment moves?
Were there investment opportunities you wish you hadn’t missed?
You can never anticipate what the market will do, but you can prepare. And increasing your market awareness is one of the best ways to do that. Over the next few weeks, we’re going to walk through a series of goals to help you start the new year strong.
This week, we’re kicking off things with Goal #1: Build a Daily Routine.
Why a Daily Routine Matters
A daily routine doesn’t mean you need to overhaul your portfolio every day. Instead, think of it as spending a few minutes checking in with the market. It’s your money at work, after all, and a quick check can go a long way toward keeping it safe.
So let’s set you up with a routine that’s simple, fast, and effective.
Step 1: Customize Your StockCharts Dashboard
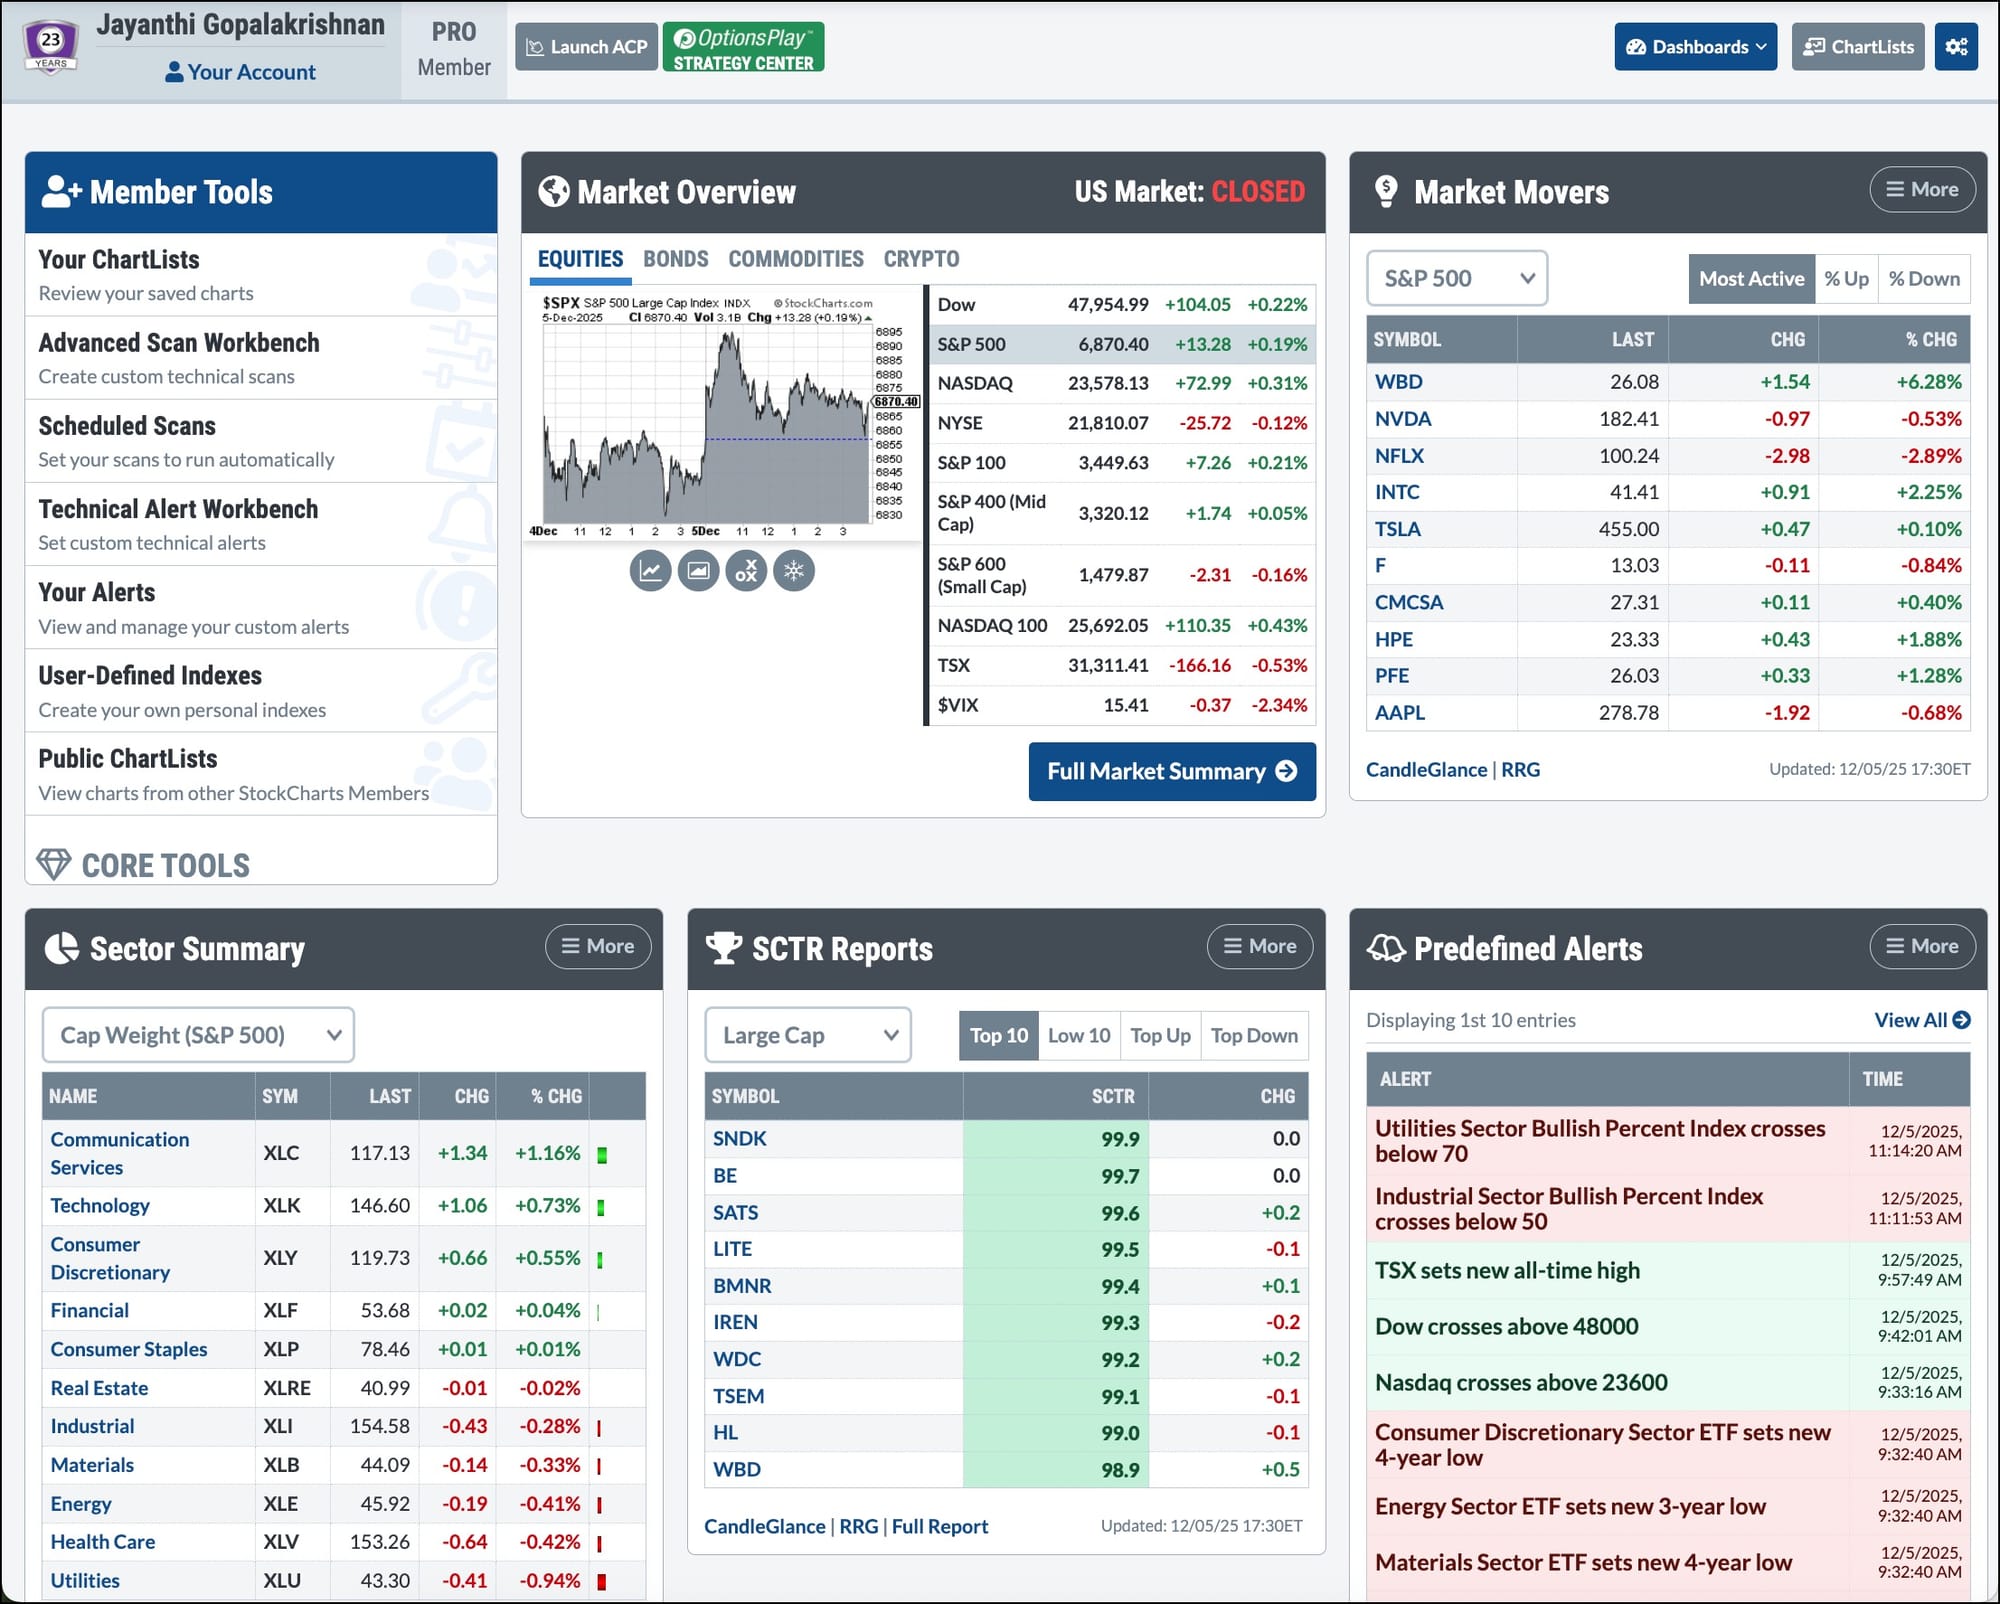
Start by logging into your StockCharts account and tailoring your dashboard to fit your workflow. The top three panels are set, but the others can be changed.
Here’s an example layout with three powerful panels that can give you insight into what’s moving — Sector Summary, SCTR Reports, and Predefined Alerts.
💡
StockCharts Tip: To change these panels, select the More button and from the menu, choose which feature you want displayed.
There are several other panels to customize. Our Support Center page has everything you need to know about customizing your dashboard.
Once you create your dashboard, your daily routine becomes as easy as a quick scan across your panels. And who knows, you might even have a new fun fact to share at your next social gathering.
Step 2: Visit the Market Summary
If you want to take things up a notch, head to the Market Summary page under the Market Analysis tab. It’s a goldmine of clean, organized market info.
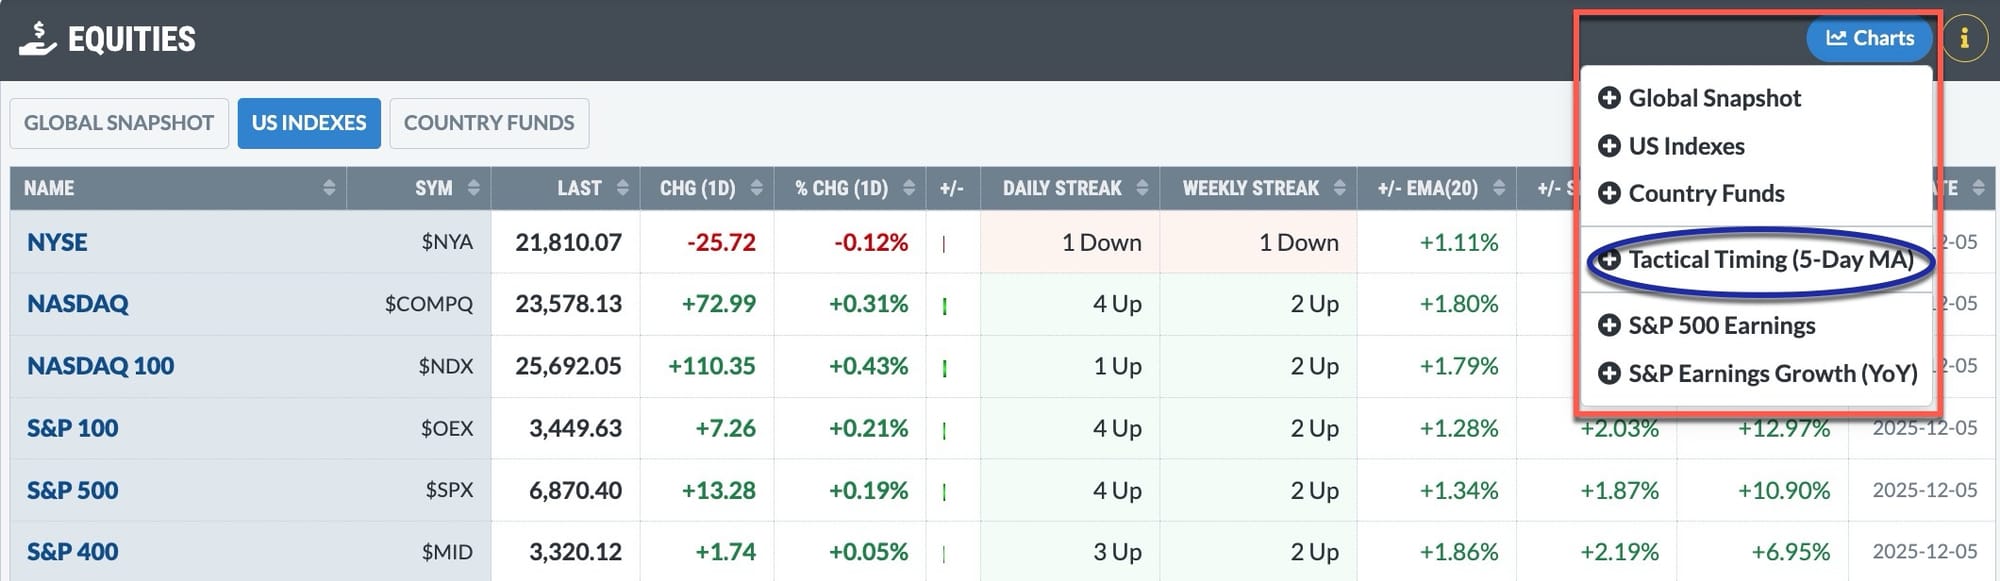
Even though the market was quiet this week, there’s plenty to observe. For example, in the Equities panel, you’ll notice that all the major indexes, except the Dow Utilities, are trading above their 20-day EMA and 50-day SMA.
Now, click the Charts button in the upper right of that panel and select Tactical Timing (5-day MA). This view is great because it shows how each index is trading relative to the prior day’s close.
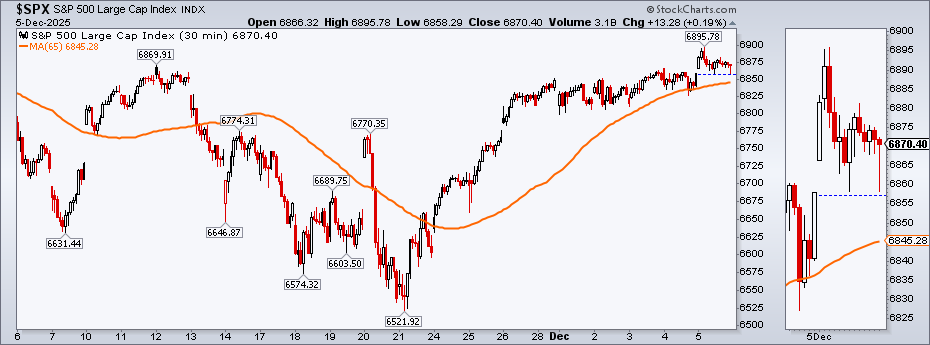
Take the S&P 500 as an example (click on chart below to see live chart). The index hovered above Thursday’s close and even bounced off that level a couple of times (see zoom thumbnail). This tells us the market is trying to push higher, but hesitating. Let’s see if we get follow-through next week.
Your Assignment This Week
Before we move on to Goal #2 next week, here are a few things to do:
Customize your dashboard
Spend a few minutes each day reviewing the data on the Market Summary page
Review the charts in each of the panels
And if you’re not a StockCharts member yet, December is the perfect time to join. Our Holiday Sale is happening all month long.
Upcoming Webinar: Don’t Miss This One
Tony Zhang, CNBC Contributor and Chief Strategist at OptionsPlay, will walk you through identifying high-probability option trade setups, automating strategy ideas from your ChartLists, and weaving options into your daily routine.
When: December 9, 12:00 PM ET What:How to Generate Consistent Weekly Income
The Nasdaq 100 sits near record highs, but where does it go from here? Dave Keller, CMT, lays out four scenarios—ranging from a Santa Claus rally to a deeper correction—and assigns probabilities to each to help investors prepare for early 2026’s next big move. ...
Technology has lost its momentum. Until it shows more leadership, it makes sense to focus on other areas of the market for potential investment opportunities. ...
The Australian dollar and Canadian dollar may be getting ready to strengthen against the US dollar. Martin Pring analyzes these two commodity-based currencies and discusses which direction the two are likely to move. ...
Before We Dive In…
Is the market trending right now, or is it chopping sideways? More importantly, should you be riding a trend, trading a range, or standing aside altogether? There may be many ways to figure this out, but John Murphy leans on one tool in particular: the Average ...
Learn how to quantify signals using new highs, new lows, and the percentage of stocks with golden crosses. Another area that could hold the key to broadening leadership in 2026 is homebuilder stocks. ...
The StockCharts Sample Gallery contains charts of economic data, such as unemployment rate, inflation, and mortgage rates. Calm bond and mortgage markets could offer a potential tailwind as we head into 2026. ...
As a StockCharts Member, you unlock all of our most powerful tools and features, including saved charts and settings, custom scans, technical alerts and much more. Discover all that StockCharts can do with our
free 1-month trial and start charting like a true market pro.