Broad participation + sector rotation + earnings season = a market worth watching.
We’re wrapping up the first full trading week of the year on a high note, as the market is giving investors something to smile about.
We may not have gotten a Santa Claus Rally, but what we did get was a positive First Five Days (FFD). That’s one piece of the January Trifecta in the bag. Now we wait for the January Barometer.
Record Highs, Broadening Participation
The market finished the week with a healthy push higher, with the S&P 500 ($SPX) and Dow Industrials ($INDU) closing at fresh record highs. Even the tech-heavy Nasdaq 100 ($NDX), which started the year looking sluggish, closed higher. There was a lot to celebrate. The VanEck Semiconductor ETF (SMH) closed at a record high, while the S&P Equal-Weighted Index ($SPXEW) hit an all-time high as well, a sign that more stocks are joining the rally. Mid- and small-caps followed a similar pattern.
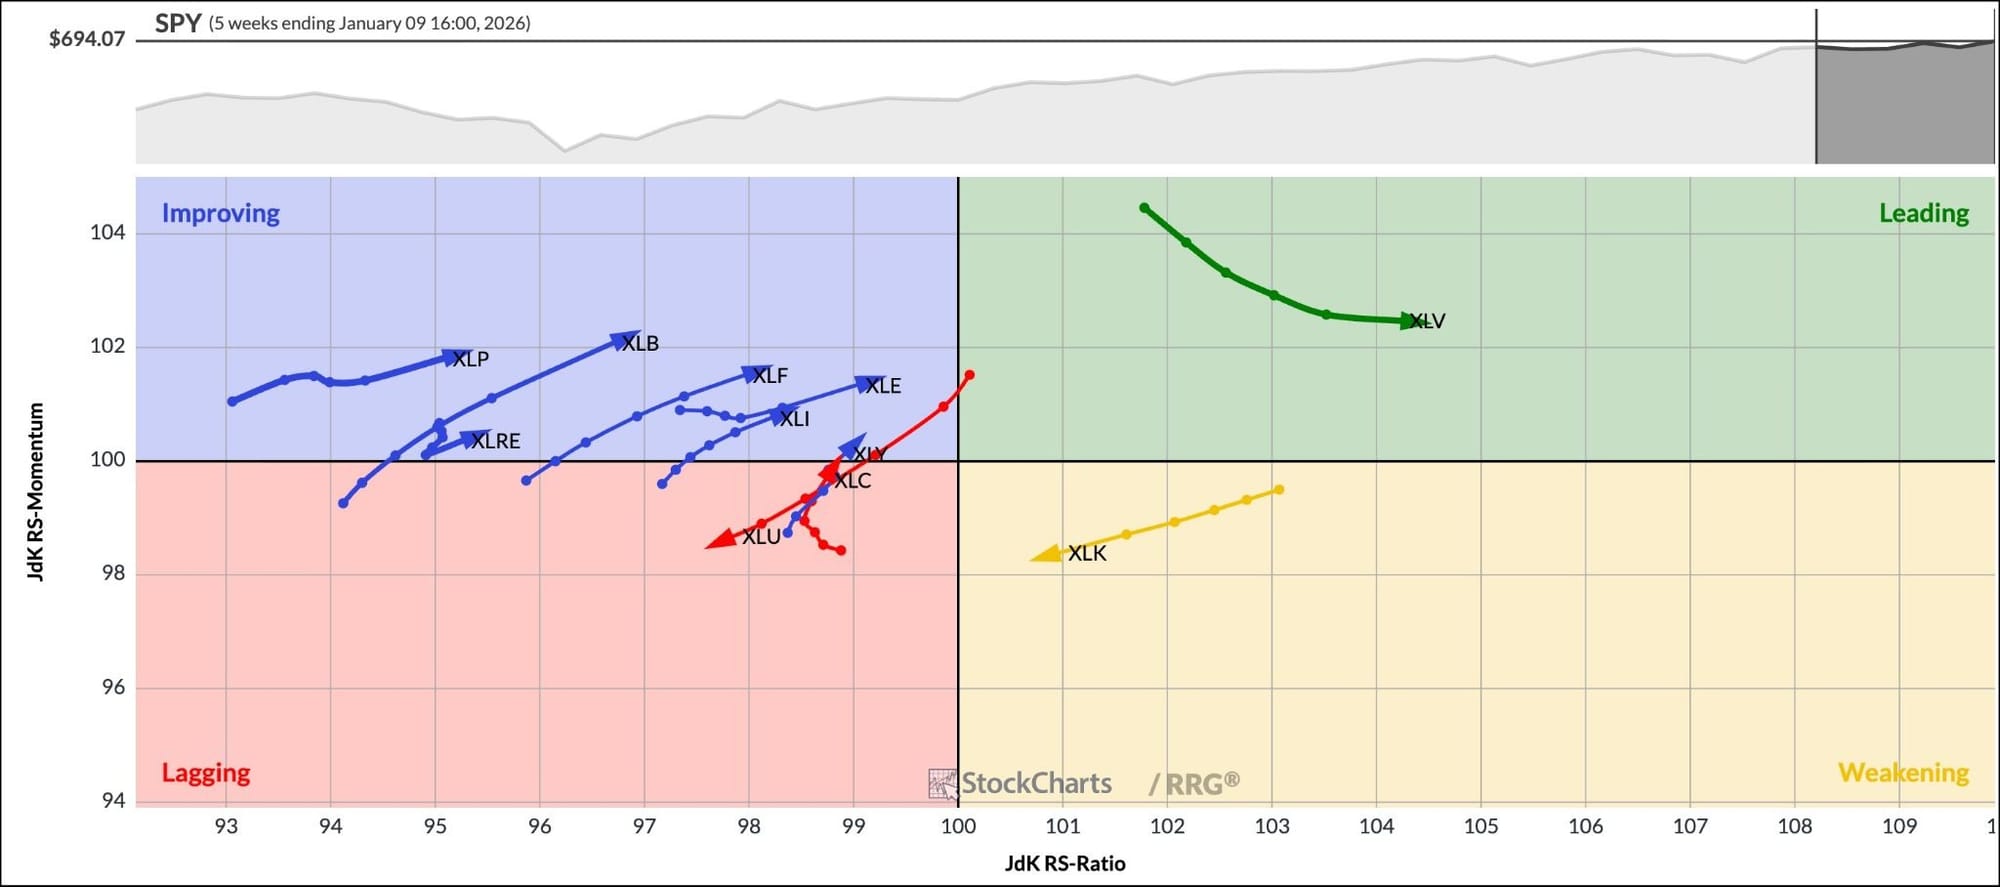
You can see this “broader participation” theme come alive in the Relative Rotation Graphs® for the S&P 500 Sector ETFs. As the saying goes, “a picture is worth a thousand words,” and that couldn’t be truer than when you look at the chart below.
This week, Materials, Industrials, Financials, and Consumer Discretionary made a notable improvement, rotating from the Lagging to the Improving quadrant. Meanwhile, Utilities rotated from the Leading to Lagging, Technology remains in the Weakening quadrant, and Health Care is the only sector in the Leading quadrant.
One big question heading into next week is, “Will the Improving sectors make the leap into the Leading quadrant?" Financials will be especially important to watch. Next week kicks off earnings season, starting with the big banks.
That leads to a second big question: "Will Financials take the lead, or will Tech start to wake up?"
After you've identified which sector(s) are leading, the next step is zooming in on the stocks within those groups that have the most potential. To make that easier, we've added a new filtering tool to our Sample Scan Library. With it, you can narrow your scan results by sectors, as well as other asset groups.
Next week, we’ll also get inflation data and retail sales. All these could bring more market movement and probably some short-term volatility.
Speaking of volatility…
Next week, OptionsPlay is hosting a webinar exclusively for StockCharts members. You’ll learn how to use the OptionsPlay Add-On to enhance your options trading, especially during volatile market conditions.
The S&P 500 is in a clear uptrend with strong breadth, and three sectors leading the trend are Finance, Health Care, and Industrials. Arthur Hills shows you how to use a top-down approach to identify oversold stocks within uptrends. ...
A shift is taking place in the stock market that investors shouldn't ignore. As leadership rotates beyond mega-cap stocks, mid-caps are breaking to record highs. What does this early-year price action indicate? Find out here. ...
Although the Energy sector has been a laggard in the past 200 days, these charts suggest this sector may be about to reverse course. Here's a unique perspective. ...
Government policy decisions are moving industry groups as the focus shifts to energy security, housing affordability, and manufacturing. Find out which stocks are showing breakout potential. ...
Before We Dive In…
Every strong move begins with tension, a buildup of energy (sometimes hidden) before the next move. While most traders only notice the explosion, those who pay close attention to volatility are generally able to anticipate the big move before it happens. We covered this in part ...
Before We Dive In…
Every trader knows that strong breakouts tend to make money as long as you’re on the right side of the move. The tricky part? Knowing when that breakout is likely to happen. What I’m about to give you is a framework for measuring volatility, ...
As a StockCharts Member, you unlock all of our most powerful tools and features, including saved charts and settings, custom scans, technical alerts and much more. Discover all that StockCharts can do with our
free 1-month trial and start charting like a true market pro.