Is the market starting to open up beyond the usual suspects?
Participation in a market rally is healthy, and lately we’ve been seeing more than just a handful of large-cap growth stocks doing the heavy lifting. This is encouraging, especially if you want to protect your capital while looking for opportunities to grow it.
Before making any big portfolio changes, though, it’s important to keep the bigger picture in perspective. While the S&P 500 ($SPX) and Nasdaq Composite ($COMPQ) have shown signs of slowing down, they’re still holding on to their long-term bullish trend, and volatility is relatively calm. So this isn’t really a time to take dramatic moves; however, it is a good time to stay alert.
What’s different right now is that small-caps, mid-caps, and the S&P 500 Equal Weighted Index ($SPXEW) are starting to participate in the bull run. This raises an important question: Are other asset groups well represented in your portfolio?
A Simple Exercise You Can Do in Minutes
The Sample Scan Library (found under Scans & Alerts) is a great way to explore what’s working in other parts of the market, and you can do it without having to build from the ground up.
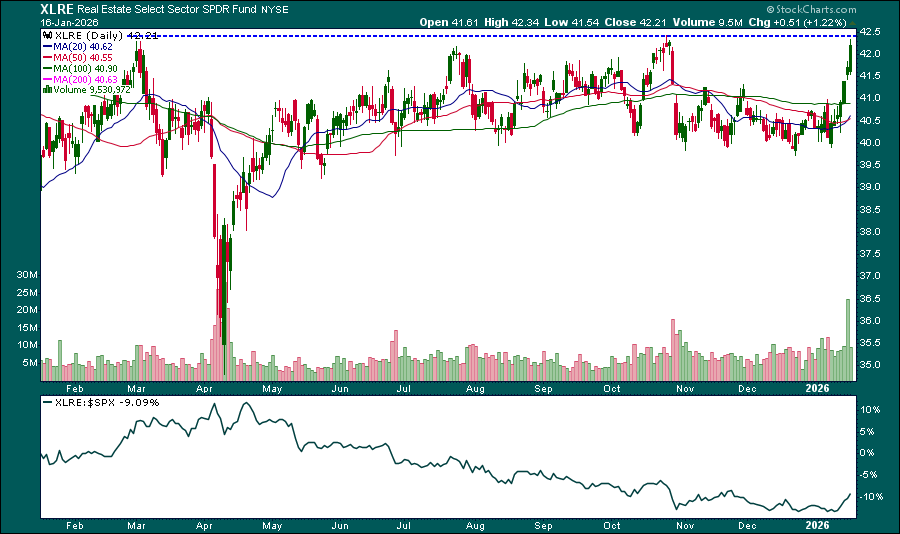
As an example, when I looked at the dashboard, Real Estate turned out to be the best-performing sector over the past week. The sector hasn’t done much since recovering from its April low (see chart below), meaning XLRE needs to break out above 42.50 and see some follow-through before getting bullish. Its relative performance to the S&P 500 also has to improve. If or when XLRE strengthens, though, it’s good to be prepared with a ChartList of potential stocks to consider, especially if real estate is underrepresented in your portfolio.
Here's what I did using the new scan filters:
Selected the Real Estate sector
Applied the RSI in Bullish Range 50–70 scan to find stocks that have the potential to break out to the upside
Sorted the scan results by SCTR scores
Ran through the charts (the StyleButtons come in very handy here)
Saved the most promising chart setups into a new Real Estate Chart List
All that took just a few minutes. Now it’s a waiting game. If momentum improves, I’ll be ready. If it doesn’t, I’ll have to move on to another set of charts.
The next step is to set alerts. Setting an alert for RSI crossing above 70 means you don’t have to constantly monitor the charts. We walked through creating an alert in a previous newsletter but, in case you missed it, our Chat Assistant (Help > Ask a Question) can generate the alert clause for you.
Try applying the scan filters and running some of the other scans available in the Sample Scan Library. Then build a few ChartLists and set your alerts.
As growth sectors lagged, Consumer Staples emerged as a rare pocket of strength. Dave Keller, CMT, highlights three standout charts—Costco, Philip Morris, and Dollar Tree—showing bullish technical setups that prove strong trends can appear in any sector. ...
Are the U.S. markets showing signs of running out of steam? Martin Pring analyzes the relative strength of U.S. indexes with respect to non-U.S. indexes. Another group that could gain momentum is small-caps. Here's what you should be watching. ...
The Technology sector has been range-bound and is undergoing some internal shifts beneath the surface. Find out what these shifts are and how you can capitalize on these moves. ...
The bull market is seeing broader participation with industry groups such as Home Construction, Retail, and Regional Bank stocks breaking out. Here's an analysis of the various sectors and industry groups that are showing strength, plus a stock you may want to consider. ...
Point & Figure charts are showing a breakout in broad commodities with a price target that suggests commodities have room to run. Here's a deep dive into the technical chart patterns that could support the run in commodities. ...
Before We Dive In…
Markets don’t always trend. They coil, surge, and then launch in one direction or another. The trick is being able to spot each phase and to use that information to act. A lone moving average can hint at direction, but it won’t tell you ...
As a StockCharts Member, you unlock all of our most powerful tools and features, including saved charts and settings, custom scans, technical alerts and much more. Discover all that StockCharts can do with our
free 1-month trial and start charting like a true market pro.
With the "Earnings Calendar" on StockCharts, you can view results for companies that have recently reported quarterly earnings and stay ahead of upcoming earnings announcement dates. Visit StockCharts.com/earnings to see more.