Who would have thought the name Kevin Warsh could move markets?
That’s exactly what happened this week. After sliding steadily since mid-January, the U.S. dollar bounced back on Friday. But the real jaw-dropper was precious metals, i.e., gold and silver.
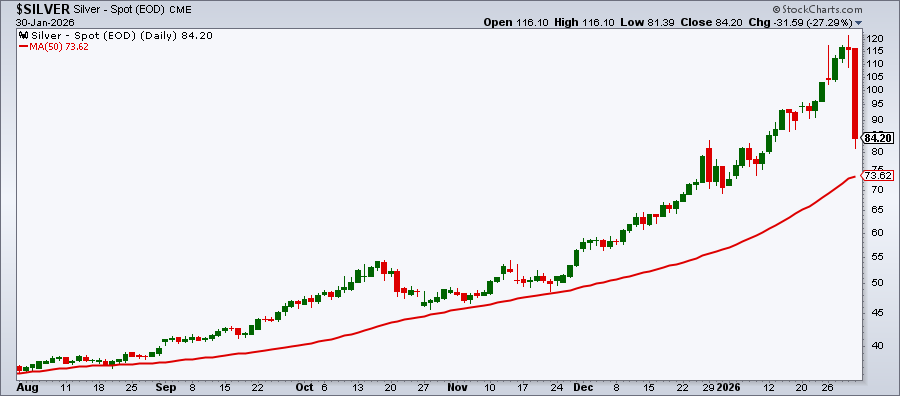
If you look at the Silver futures below, Friday’s action really jumps off the screen. In one day, silver erased nearly all of January’s gains, plunging about 30% before reversing. Despite the massive selloff, silver stayed above its 50-day Simple Moving Average (SMA), a level many investors watch closely.
Stocks didn’t escape the volatility either. Earlier in the week, tech stocks were showing signs of life and hinting at a possible breakout. By Friday, that momentum cooled. Still, looking at the weekly charts, the major indexes were relatively flat.
As for January — Friday was the last trading day — the S&P 500 ($SPX) finished up 1.37%.
This brings us to the January Trifecta.
✖ Santa Claus Rally ✅ First Five Days of January ✅ January Barometer
Two out of three? We’ll take it.
So, how much did Friday’s action impact the overall market? For now, things look solid. The major indexes, S&P 500, Nasdaq Composite ($COMPQ), and Dow Jones Industrials ($INDU), remain above their 50-day SMAs. The Cboe Volatility Index ($VIX) is still below 20, and the NYSE Advance-Decline Line and the NYSE McClellan Summation Index continue to support a bullish trend.
One area worth keeping an eye on is the percentage of Nasdaq stocks trading above their key moving averages. That’s been slipping, which is a little concerning. On the bright side, we haven’t seen enough technical damage to sound the alarm bells, especially compared to the dramatic swings we saw in gold and silver.
The market tends to drift back towards its averages over time (see Bob Farrell's 10 Rules). This week was a reminder of that reality.
Looking ahead, earnings season continues with Amazon and Alphabet taking center stage. Let’s see if their reports move the needle in the tech space.
If nothing else, this week has shown that noisy headlines can be distracting. But the clear visuals of the charts, indicator signals, and tools from StockCharts can help you stay focused.
Be sure to check out this week's video, "Top 10 Charts Revealed — February 2026 Market Shifts." Grayson Roze and Dave Keller break down the charts that are shaping the market. And as a bonus, we're sharing the shared ChartList from the video, so you can explore each setup yourself.
One more thing …
There’s a big game coming up next Saturday, February 7 🎉
It’s Fantasy Stock Draft II, also known as The Super Bowley Challenge.
This time, the SCTR team faces off against Tom Bowley, Grayson Roze, Julius de Kempenaer, and David Keller. Which stocks will they pick this time?
As former market leaders stumble, opportunity still exists for disciplined chart watchers. Dave Keller, CMT, highlights three constructive technical setups—Walmart, CVS Health, and Comcast—that demonstrate how strength, support, and breakouts can emerge even in a choppier market environment. ...
When markets experience above-average volatility, dividend-paying stocks can provide stability to your portfolio. Here are three stocks with attractive setups and dividends. ...
These charts indicate the stock market is showing warning signs. Tom Bowley analyzes the price action in semiconductors, cryptocurrencies, rotation away from growth, and sentiment measures to make his case. ...
In the last few weeks, the Financials sector took a hit. However, it's oversold within a long-term uptrend. Find out what indicators Arthur Hill uses to identify an ideal long setup. ...
Commodity prices are rising and have the potential for further upside movement. Martin Pring analyzes the CRB Index from different perspectives. Find out what his charts show. ...
Morgan Stanley shows strong relative strength. Learn how a bullish trend-following setup and a bull call spread can target upside with limited risk. ...
As a StockCharts Member, you unlock all of our most powerful tools and features, including saved charts and settings, custom scans, technical alerts and much more. Discover all that StockCharts can do with our
free 1-month trial and start charting like a true market pro.