It was another week of relatively little movement in the stock market. Yes, tariff headlines stirred things up a bit, but as the dust settled, the major indices quietly edged higher.
Here’s their weekly performance:
Dow Jones Industrial Average ($INDU): 49,625.97 (+0.25%)
S&P 500 ($SPX): 6909.51 (+1.07%)
Nasdaq Composite ($COMPQ): 22,886.07 (+1.51%)
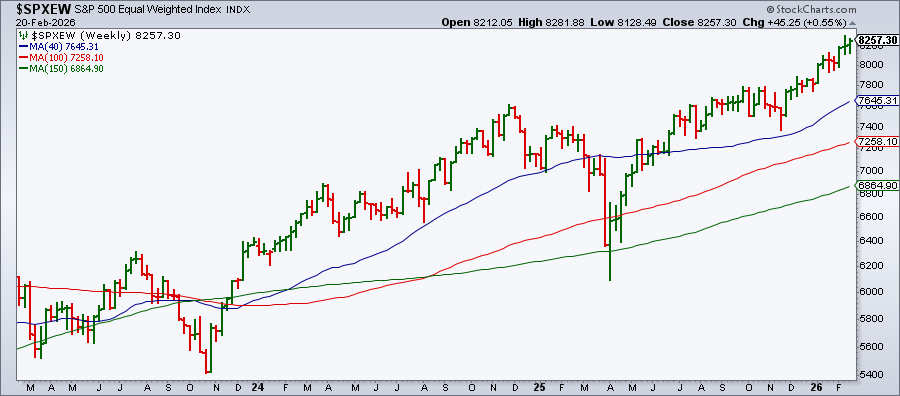
It’s not exactly exciting. What’s more interesting, though, is that the S&P 500 Equal Weighted Index ($SPXEW) finished the week at a record close.
Why does this matter? Unlike the standard S&P 500, which is heavily influenced by mega-cap stocks, the equal-weight version gives all 500 companies the same weight. That means the rally isn’t being carried by the Magnificent 7 but, rather, by the other hundreds of companies in the index.
Want to see what’s really moving?
You may be wondering which stocks are leading right now. Here’s a simple way to find out.
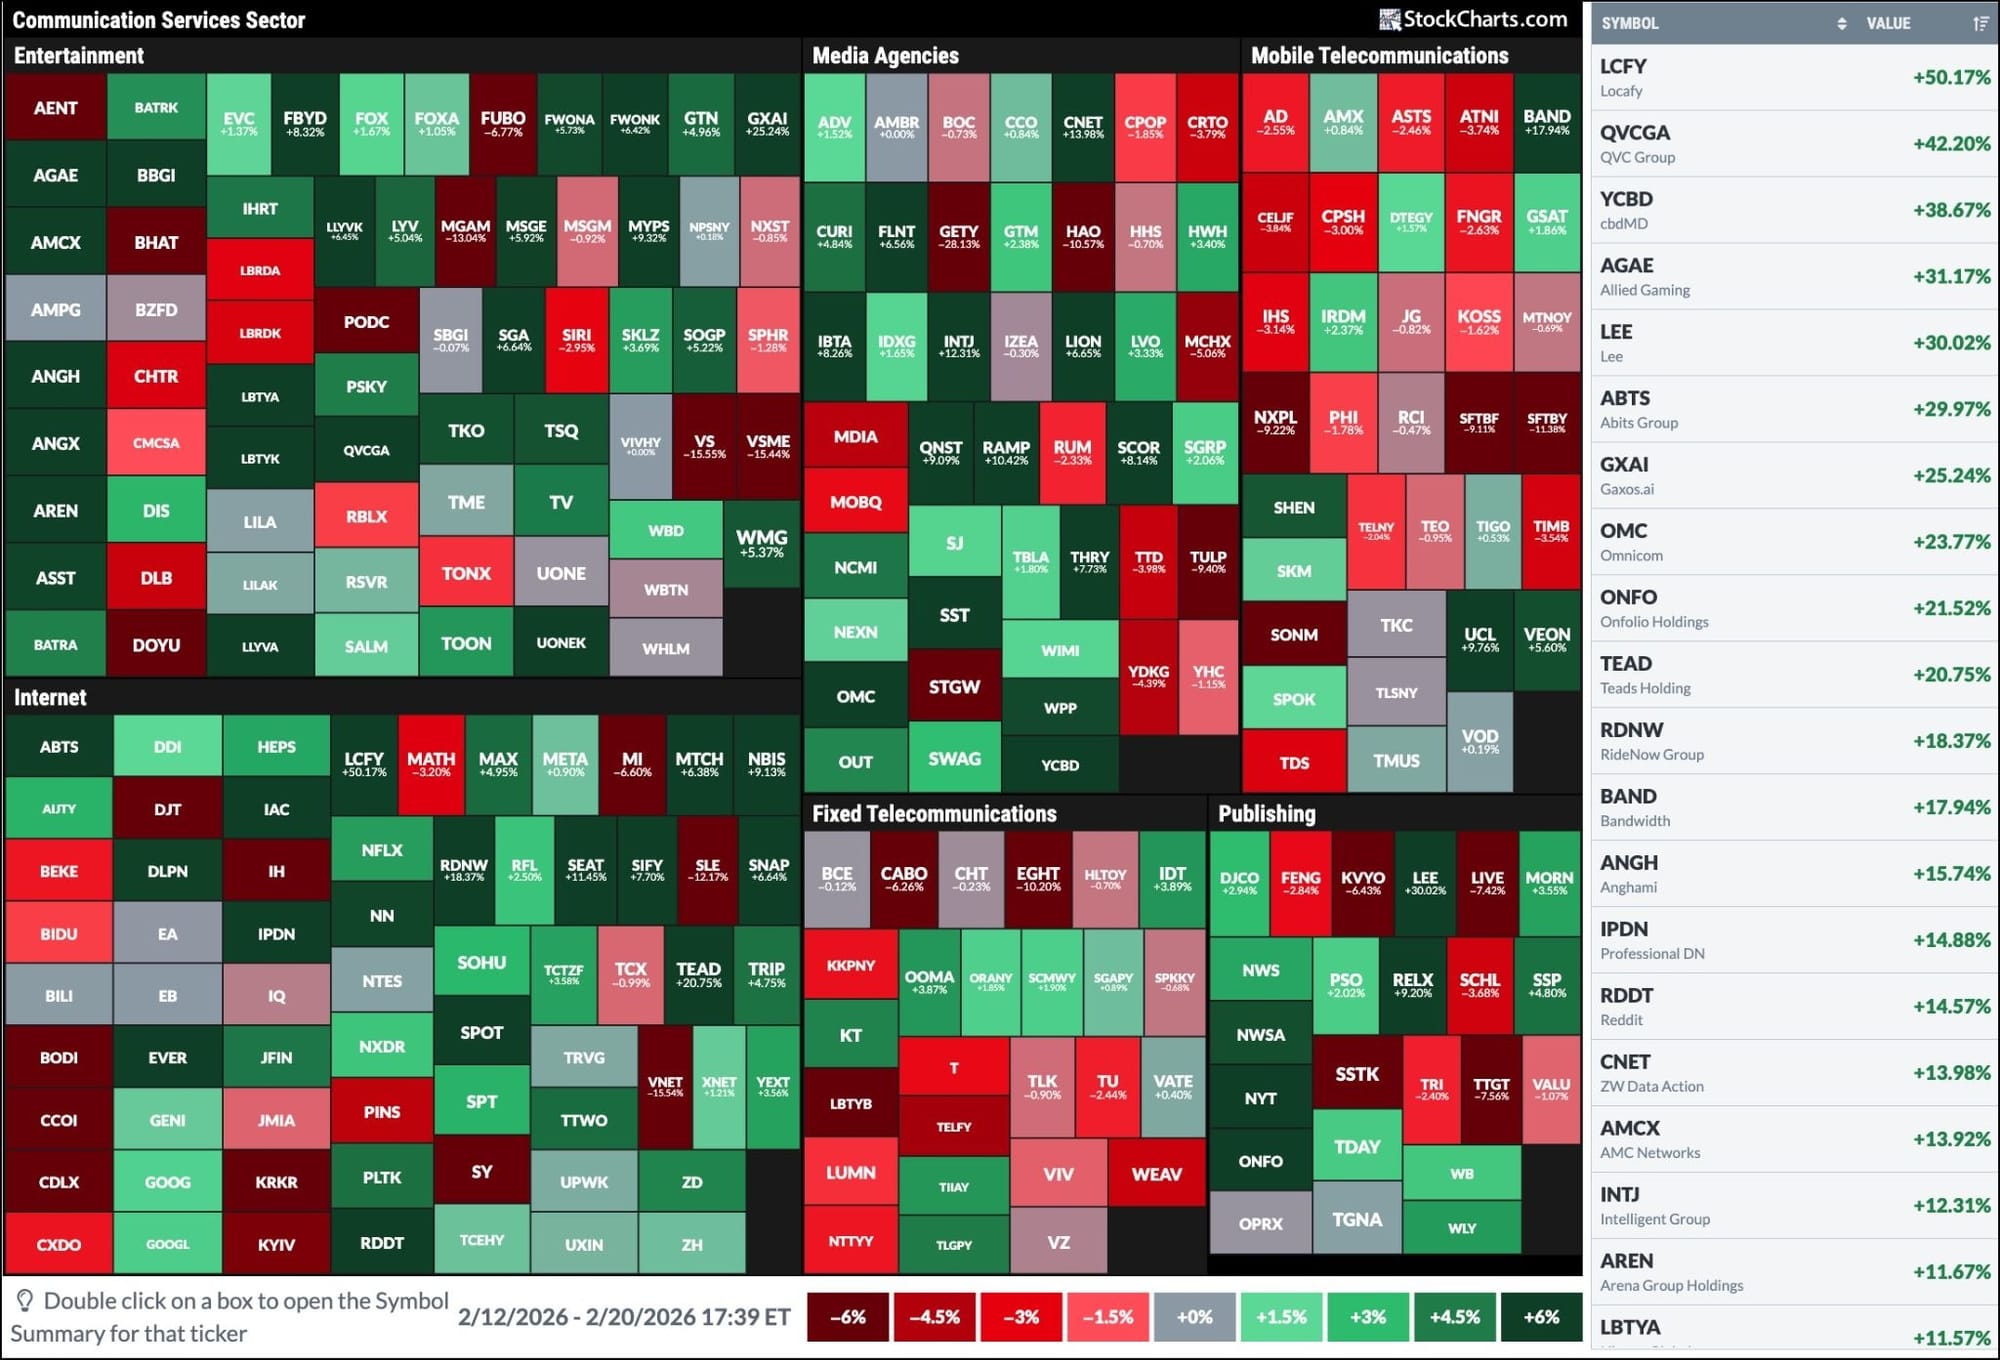
Start with a Sector Drill-Down (from the Sector Summary panel or access it from the Market Summary page) and look at the one-week performance. This past week, Communication Services took the top spot. Which stocks in the Communication Services sector gained the most? When you zoom in using the StockCharts MarketCarpets, a visual heat map tool, you can instantly see the stocks within the sector that drove performance.
To try this yourself:
Go to the Charts & Tools tab.
Select MarketCarpets.
In Select Group, choose Communication Services.
In Color By, select 5D Change.
In Size By, choose Equal Weight.
The table on the right (and if you don’t see it, click the Table icon on the top right) displays the performance of the stocks within the Communication Services sector. Note that the two mega-cap giants of this sector, Alphabet and Meta, weren’t the top performers.
Now try this with other sectors. All you have to do is change the sector from the Select Group drop-down.
Take it one step further: How do your stocks compare?
Try to identify stocks in your portfolio using the MarketCarpets tool. Are they outperforming the broader market or lagging it?
Now pull up a chart of a specific stock and analyze its relative performance.
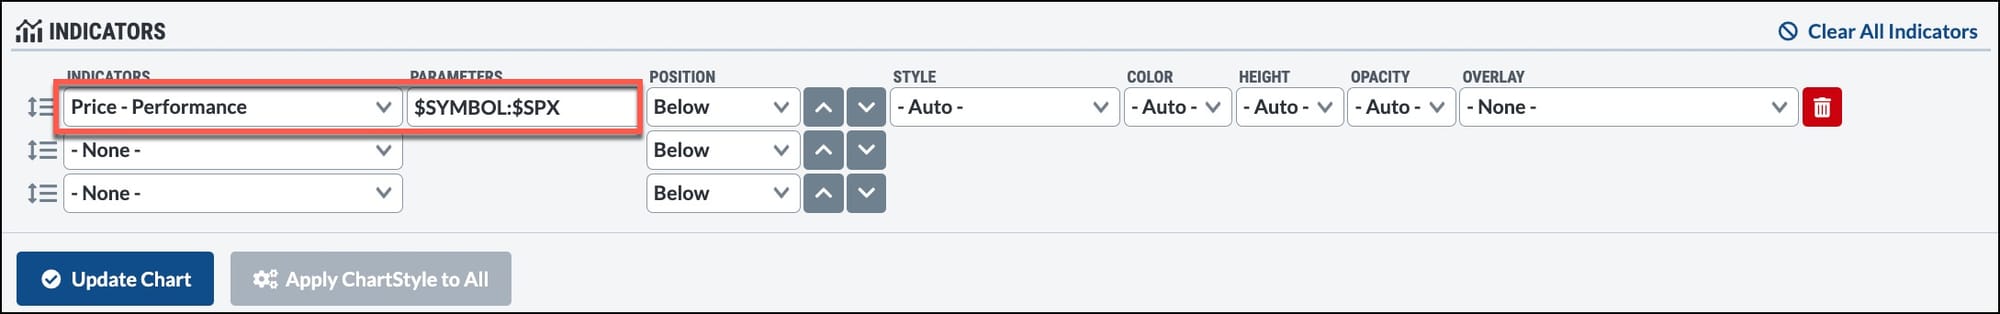
Select Price - Performance as your indicator and add $SYMBOL:$SPX in the Parameters box. This compares your stock’s performance against the S&P 500.
You can compare it against another stock, ETF, or even its sector. Just swap out $SPX for another symbol. Oftentimes, we look at the overall value of our portfolio. But a relative strength analysis can tell you which of your stocks are outperforming or lagging a benchmark.
Looking Ahead
Next week’s calendar is fairly light. The big events to watch are NVIDIA’s earnings and the January PPI. Of course, with geopolitics in focus, volatility can appear when we least expect it. But, for now, the market is showing resilience.
Have a wonderful weekend and Happy Lunar New Year!
The S&P 500 remains locked in a multi-month consolidation as leadership rotates from growth into value. Dave Keller, CMT, updates key support and resistance levels and explains how momentum signals, especially RSI, could confirm the S&P 500's next breakout or breakdown. ...
The stock market is clearly in defensive mode but QQQ is still holding up, and its long-term breadth still hasn't turned bearish. Arthur Hill's analysis identifies the key levels to watch. ...
Before We Dive In…
Ichimoku Cloud breakouts can be an incredibly effective way to jump into a trend but only if you follow the right steps when pulling the trigger. You can easily find these breakouts while fine-tuning your criteria using StockCharts’ Updated Scan Filters. However, if you simply focus ...
How weak is the US dollar looking? Martin Pring analyzes the US Dollar Index and shows us that the dollar may not be in as bad a position as many think. ...
Tony Zhang discusses a bullish counter-trend options setup for Amazon's stock. Here's how he found the trade and why he's seeing a high-conviction contrarian play. ...
With several event catalysts now within the 30-day VIX window, it's time to ask: Does the market have a volatility problem? Mike Zaccardi breaks down the charts and assesses the danger. ...
When high-flying stocks tumble, is it a buying opportunity or the start of a deeper decline? Dave Keller, CMT, uses Alaska Air as a case study to show how momentum divergences and moving averages can confirm a true bottom—then applies the framework to PLTR and COIN. ...
As a StockCharts Member, you unlock all of our most powerful tools and features, including saved charts and settings, custom scans, technical alerts and much more. Discover all that StockCharts can do with our
free 1-month trial and start charting like a true market pro.