With the stock market closed for Good Friday, it’s a great chance to take a step back and see where things stand after a volatile week. In a way, the shortened trading week may have been a gift. Had the market been open on Friday, we might have seen even more surprises following the stronger-than-expected jobs report.
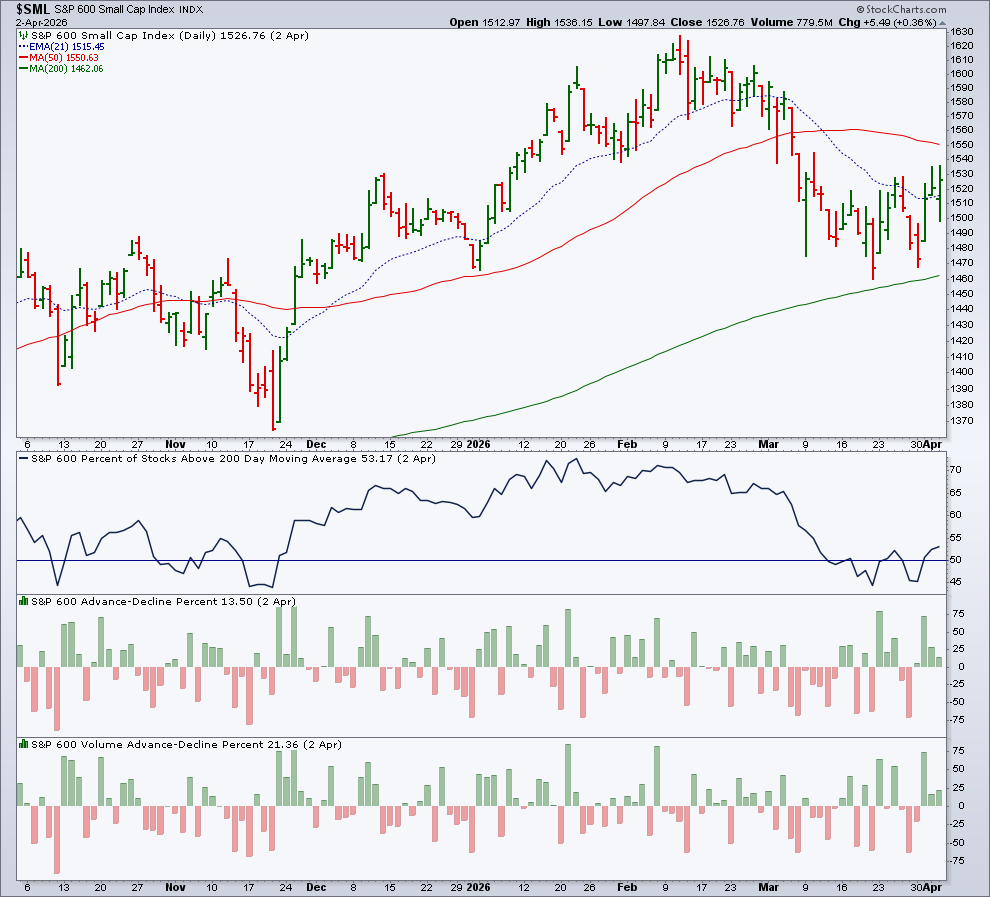
A quick look at the StockCharts Dashboard shows that the S&P 600 Small-Cap Index ($SML) has held up better than the S&P 500 ($SPX), Nasdaq ($COMPQ), and Dow Jones Industrials ($INDU). The strength in the small-caps is especially interesting because they’re often seen as a window into the domestic economy. At the moment, the S&P 600 Small Cap Index is trading above its 200-day simple moving average (SMA) and 21-day exponential moving average (EMA). In addition, more than half of S&P 600 stocks are trading above their 200-day SMAs, and advancing stocks are outpacing decliners (see chart below). So, from a trend and breadth perspective, small caps are looking resilient relative to the large-cap stocks.
💡
Click the above chart to view the live version.
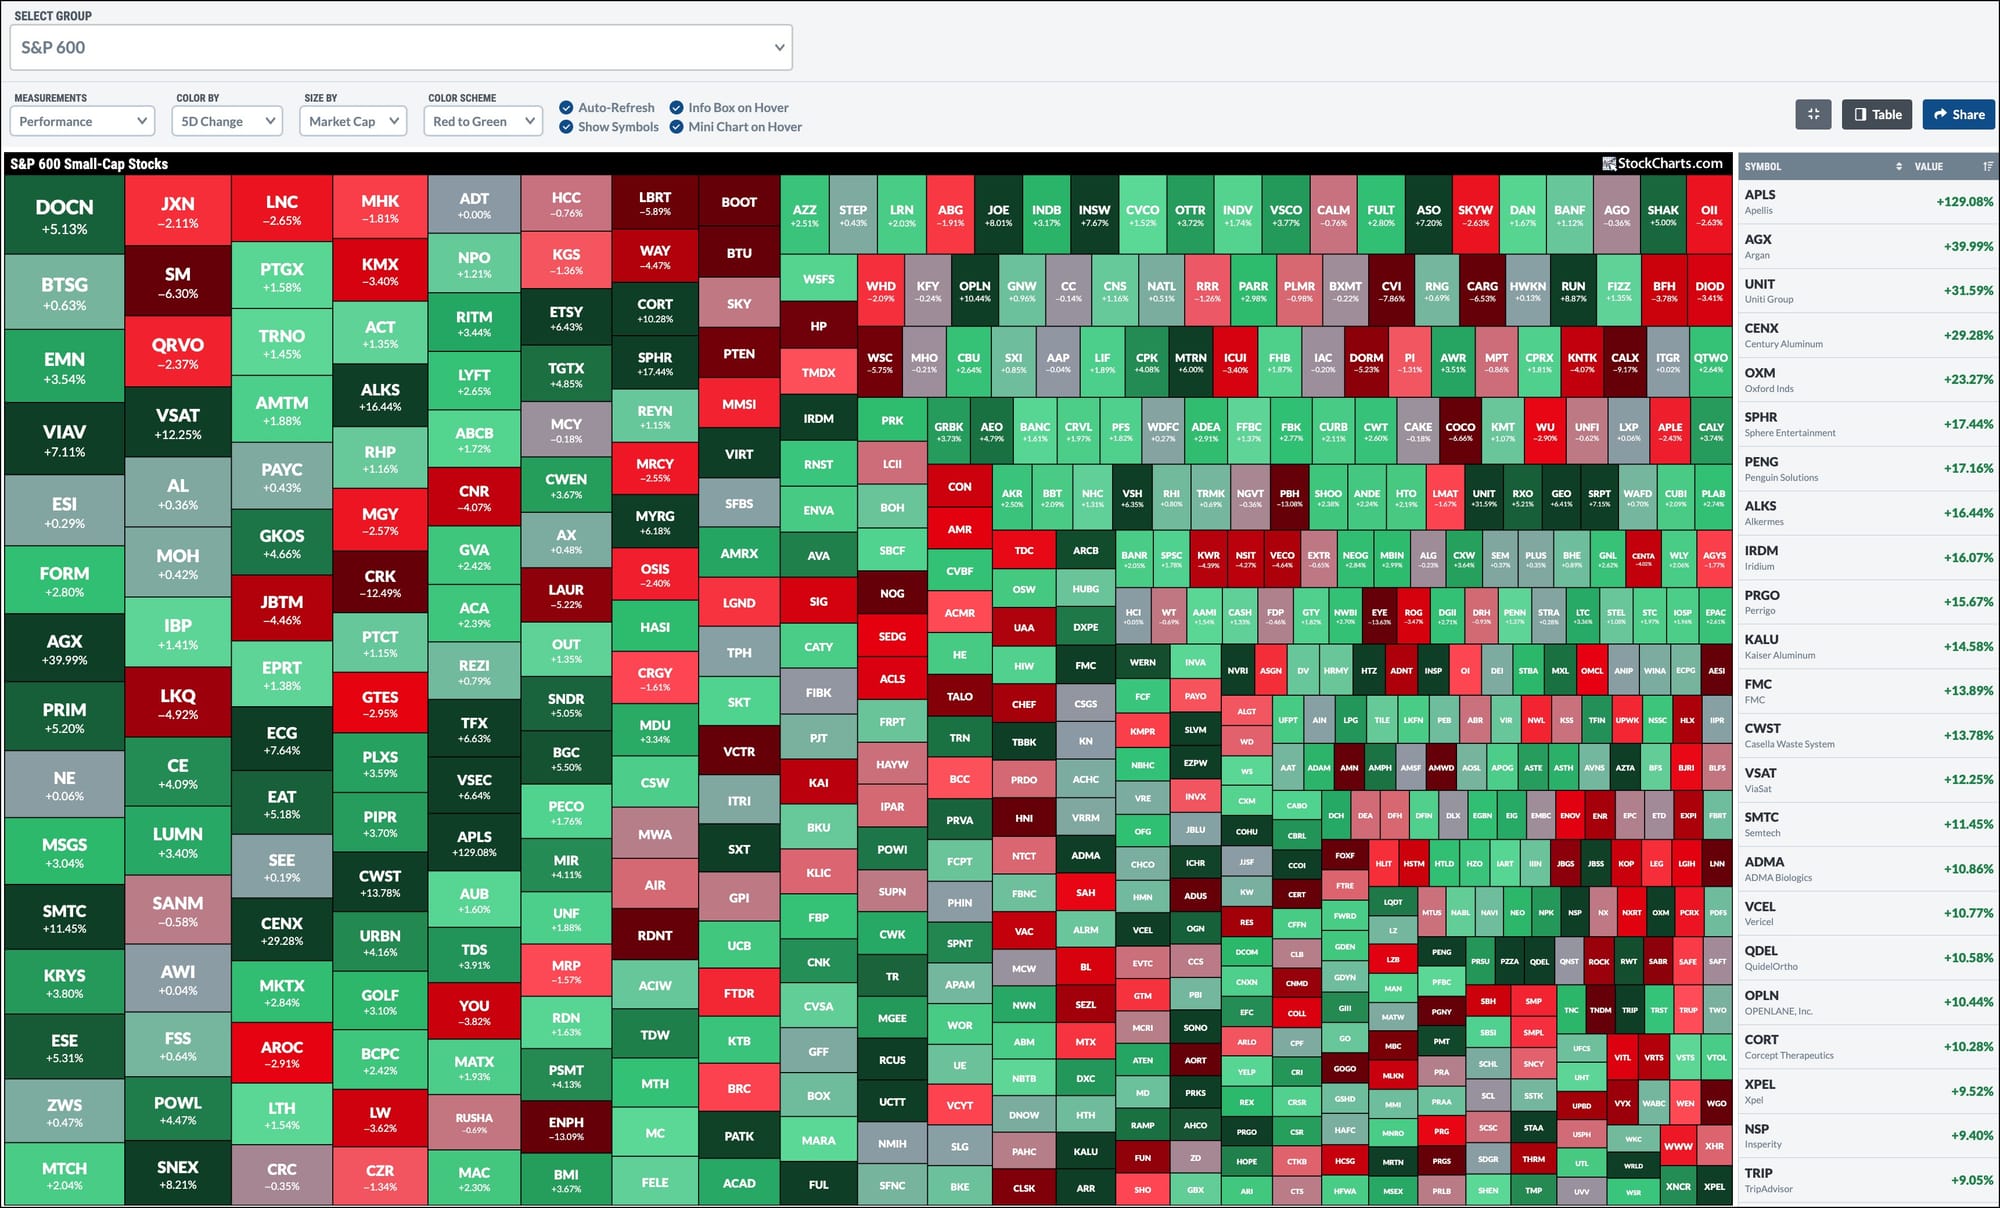
If small caps are starting to lead, which stocks are doing the heavy lifting? One way to find out is to use the MarketCarpet tool. This technical heatmap gives you a quick visual read on which stocks are driving performance within an index.
For example, if you select the S&P 600 group and view the MarketCarpet by 5-day performance, you can quickly spot the top performers, either by finding them within the carpet itself or using the table on the right. When working with 600 stocks, the table is often the simpler way to go.
From there, you can plug the symbols into the Symbol Summary page to get a snapshot of each stock’s technical and fundamental picture. If you see something you like, add it to a ChartList using the button right below the symbol.
Adding stocks to a ChartList helps you stay organized and makes it easy to keep an eye on stocks that are starting to stand out. If these stocks start to lead the market higher and the technicals fire buy signals, they could be worth following more closely.
They may not be the large-cap growth names that led the market in the past, but markets change. When that happens, it’s worth taking the time to get to know the new leader. Successful traders and investors notice the structural shifts and recognize when new opportunities may be emerging.
After a sharp countertrend rally, key signals remain mixed. Dave Keller, CMT, outlines three conditions for a bullish turn—rotation into offensive sectors, improving breadth, and breakouts in growth stocks—to determine if the S&P 500 can sustain a recovery in April. ...
Master the Zweig Breadth Thrust (ZBT) indicator with Arthur Hill. Learn the exact chart requirements for a valid signal and why the "breadth thrust" can be used to forecast powerful, long-term market rallies. ...
Extreme bullish or bearish sentiment is often an early sign of a stock market reversal. Tom Bowley shows you how to apply a sentiment indicator to identify potential reversals effectively. ...
Is this stock market rebound real or just a relief rally? Learn what the S&P 500, Nasdaq, VIX , and oil prices say about whether now is the time to buy stocks. ...
Is the U.S. stock market going to make a secular turn? Martin Pring analyzes the relative performance of the NYSE relative to the S&P 500 and explains how it can indicate a potential shift in the market's structure. ...
Tony examines the imminent completion of Marriott's head-and-shoulders pattern as economic worries bring the post-pandemic "travel boom" to a halt. ...
What intermarket trends should investors monitor in Q2? Discover how the relationships between stocks, bonds, commodities, and the US dollar provide early clues on shifts in the stock market's price structure. ...
Has the market bottomed? Mary Ellen McGonagle shares William O'Neil's insight on the "Follow-Through Day" concept, along with how it can help you resist the temptation to buy at the bottom. ...
As a StockCharts Member, you unlock all of our most powerful tools and features, including saved charts and settings, custom scans, technical alerts and much more. Discover all that StockCharts can do with our
free 1-month trial and start charting like a true market pro.