Strong earnings from Intel (INTC), hopes for peace, and renewed enthusiasm for AI-related stocks helped propel stocks higher this week. The S&P 500 ($SPX) and Nasdaq Composite ($COMPQ) closed at record highs, with semiconductors doing most of the heavy lifting.
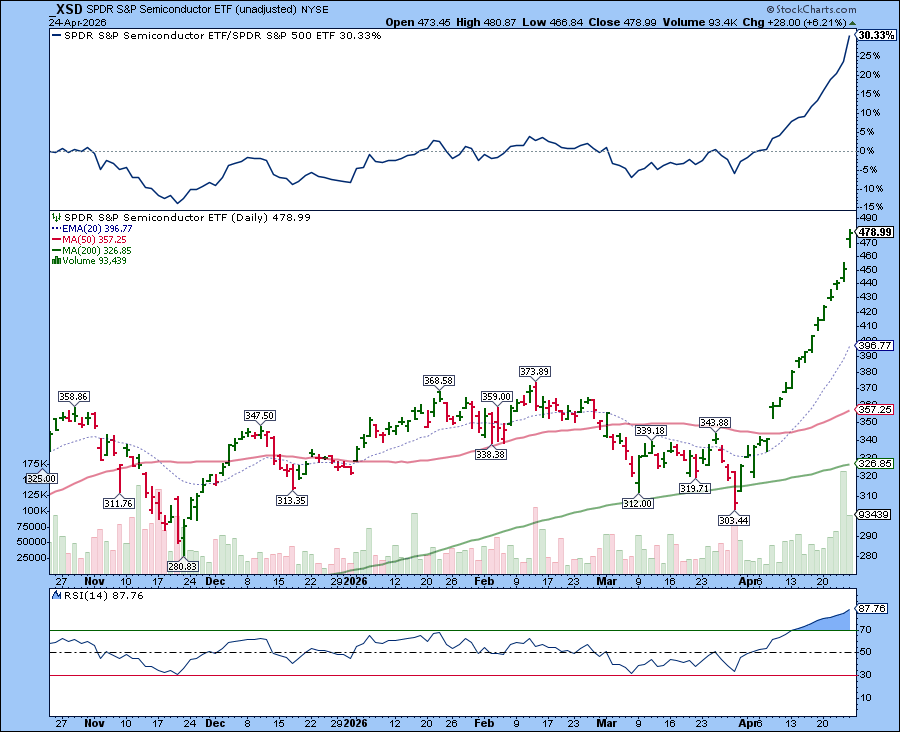
Just take a look at the chart of the SPDR S&P Semiconductor ETF (XSD)! You'd be pretty bummed out if you missed this ride.
That’s 18 up days in a row! And the relative strength line in the top panel shows how much semiconductors have influenced the recent rally.
What’s mind-blowing is that all this optimism is happening at a time when oil prices are still elevated, gold is barely budging, Bitcoin is stalling, and, even though there’s a ceasefire, the war is still not over.
Real-Time Commodity Prices Now Available in StockCharts
Over the last couple of months, oil prices have been heavily influenced by headlines. Investors have been watching crude oil like a hawk, especially during pre-market hours.
From Sunday, you can follow crude oil spot prices and other key commodities in real time on the StockCharts platform. So when you’re preparing for next week’s price action on Sunday night, type $WTIC for light crude oil or $BRENT for Brent Crude in the symbol box, and you'll get access to real-time prices.
A significant rise or drop will give you an early indication of how the market is interpreting the weekend negotiations. You don’t need to hear the news; the charts will tell the story.
Blowout Earnings
So far, earnings have been phenomenal. According to FactSet, earnings are coming in well above average. But the biggest earnings week is yet to come.
Next week, we have a tech earnings smorgasbord, with reports from Meta Platforms (META), Microsoft (MSFT), Amazon (AMZN), Alphabet (GOOGL), and Apple (AAPL). If Intel’s earnings are a sign of things to come, we could see a pretty wild market next week, one you won’t want to miss.
💡
Find out which companies are reporting earnings from our Earnings Calendar.
Next week is a pretty important week. The market is acting as if the war is winding down, AI-related stocks are back in vogue, and there’s a Fed meeting on the calendar. In short, this is not the week to take your eyes off your portfolio.
Last Call: Spring Sale Ends Sunday
This is the perfect time to take advantage of our Spring Sale.
Whether you're renewing or extending your StockCharts subscription or are ready to analyze the market like a pro, you can save 20% on all six and 12-month plans.
But you have to act quickly. The sale ends Sunday.
As oil prices rise, interest is shifting towards alternative sources such as solar, battery storage, and nuclear. NextEra and Eaton are showing signs of price breakouts and increased momentum. ...
After surging above 7000, the S&P 500 has stalled, leaving investors to question the next move. Dave Keller, CMT, outlines four bullish and bearish scenarios through mid-June, helping investors weigh risks, opportunities, and key market signals ahead. ...
In this study, Cedric Thompson, CMT, CFA, deconstructs the S&P Bullish Percent Index and shows how it's a valuable tool for identifying high probability turning points in the S&P 500. ...
The stock market decline in March was a correction within a bull market. Arthur Hill highlights trend signals for sector ETFs and focuses on Industrials and Materials, two sectors that are set up for a bullish run. ...
Are U.S.-traded Gulf ETFs positioned to benefit from a potential cooling off in Middle East tensions? Martin Pring analyzes the charts of these ETFs and shares some surprising findings. ...
The S&P 500 and Nasdaq hit new highs, but weakness in Dow Transports and Real Estate tells a more cautious story. See what the charts reveal about market strength. ...
Bitcoin has posted a 30% return from its February 6, 2026 cycle low. Here are key price levels to watch as we head into a seasonally strong period for the cryptocurrency. ...
As a StockCharts Member, you unlock all of our most powerful tools and features, including saved charts and settings, custom scans, technical alerts and much more. Discover all that StockCharts can do with our
free 1-month trial and start charting like a true market pro.