It was a strong week for the stock market with the Nasdaq Composite ($COMPQ) closing above 25,000 for the first time. The S&P 500 ($SPX) and S&P 600 Small Cap Index ($SML) also notched record closing highs.
A lot of that strength came from big tech. Several of the major tech companies reported solid earnings this past week, reassuring investors that large businesses are still spending and investing. That helped reignite enthusiasm in the Technology sector. Semiconductors continued to push higher, and software stocks are starting to build momentum, too.
With all this bullish enthusiasm in the stock market, why would anyone sell in May and go away?
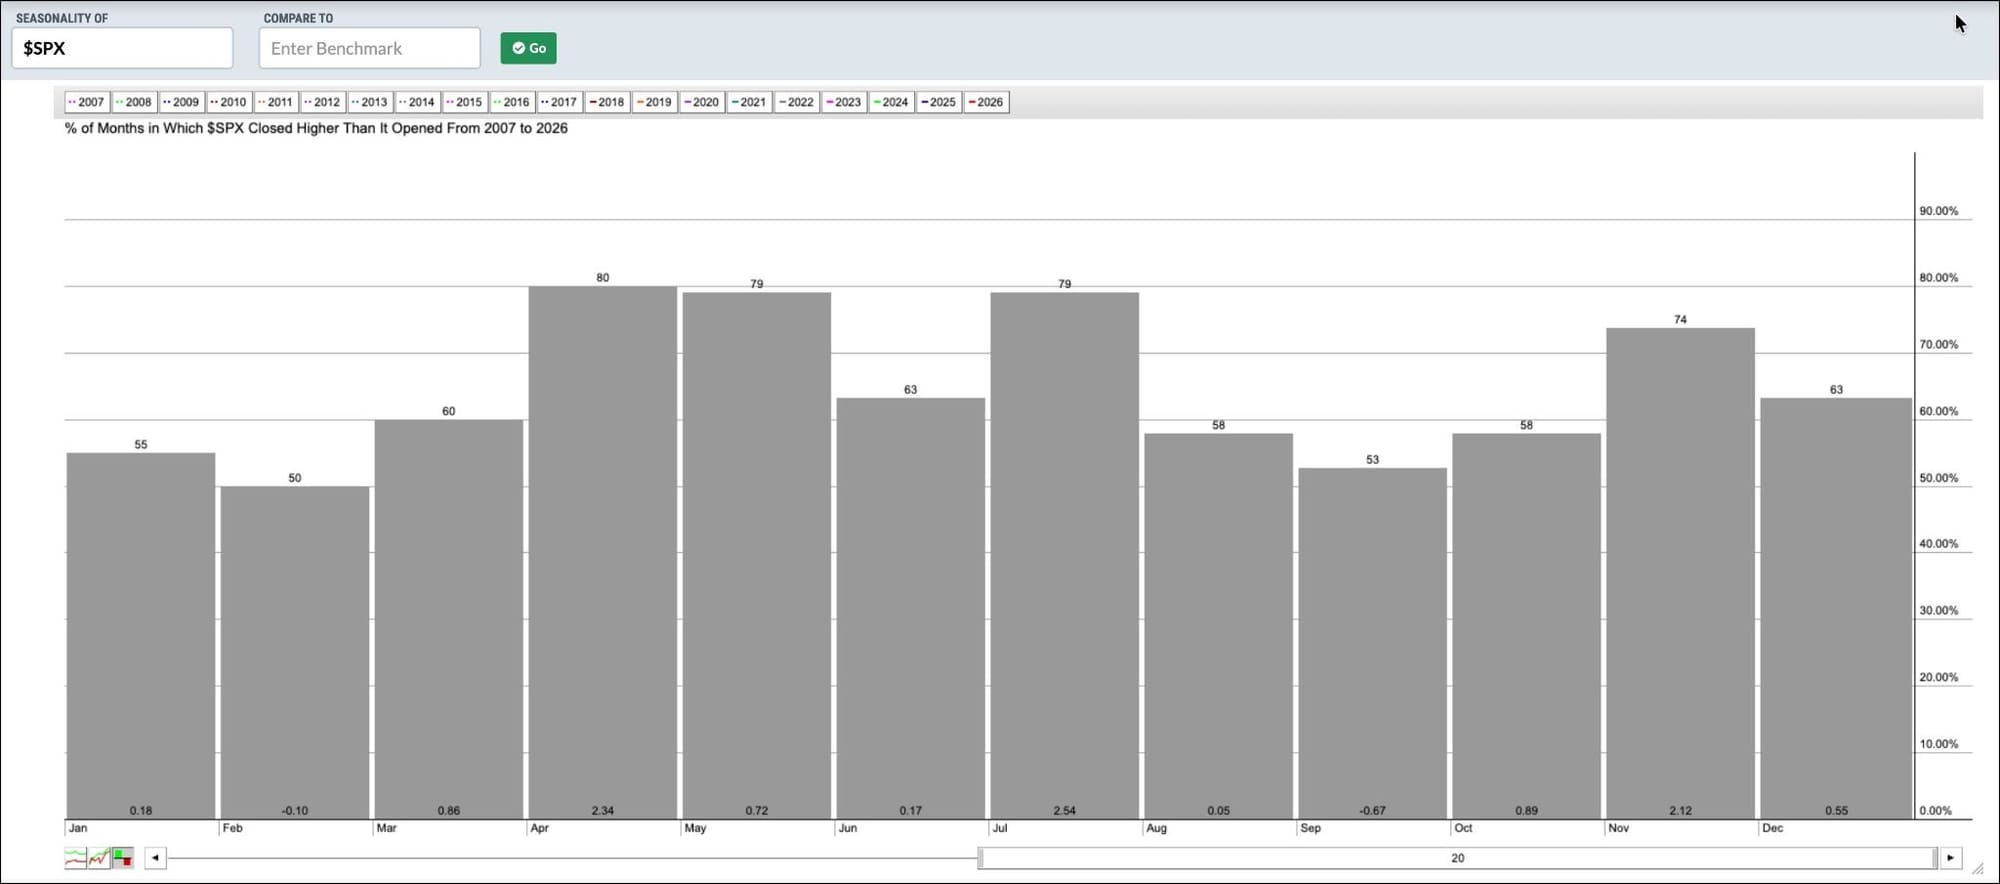
The chart below shows the Seasonality Chart of the S&P 500 over the past 20 years.
On the surface, May might not look too exciting. Over the past 20 years, May has been positive 79% of the time, with an average return of 0.72%. That’s not a whole lot, but here’s where it gets interesting.
Open the Seasonality Chart, type $SPX in the symbol box at the top left, and drag the slider at the bottom of the chart to change the lookback period to 10 years. You’ll see that average returns are much stronger. Shorten the timeframe even more, and the picture looks even better.
💡
Cool Tip: Click the seasonality chart for a five-year lookback period.
You can also try it with other symbols, such as $COMPQ or the Nasdaq 100 ($NDX). Then take it a step further by comparing the seasonality of a sector ETF to a benchmark index. For example, try viewing the seasonality of XLK vs. $NDX. This will show you what percentage of months XLK outperformed the $NDX.
💡
For a quick walkthrough of StockCharts’ Seasonality Charts, check out our Support Center page.
The seasonality chart can help you identify sectors, stocks, and ETFs that have historically performed well during certain months of the year. But remember, these are all based on past performance and probability. When it comes to the stock market, nothing is ever set in stone.
Next week brings another round of earnings with some big names on deck, including Palantir, AMD, Disney, Arm Holdings, and Pfizer. If these reports come in anything like what we’ve seen over the last few weeks, there’s a good chance the market could continue to push higher.
Then again, it’s always a good idea to keep an open mind. The market looks overextended and any escalation in the Middle East conflict could quickly shift investor sentiment.
As I mentioned last week, keep an eye on crude oil. Here's a link to an intraday chart that you can fire up on Sunday night to get a head start on the first full trading week of May.
The S&P 500 and key stocks gapped to new highs, but follow-through will determine the trend. Dave Keller, CMT, explains “gap and run” versus “gap and fail” patterns, using recent moves in Oracle, Alphabet, and Apple to assess whether bullish momentum can continue. ...
Arthur Hill presents a simple strategy for identifying long-term uptrends and short-term breakouts after corrections, using two important indicators. ...
The S&P 500, Nasdaq, and the S&P 600 closed at new highs despite inflation concerns and geopolitical tensions in the Middle East. What's driving this rally? Find out here. ...
The AI narrative is shifting. With semiconductor stocks facing a downside correction, here are the two cheapest semiconductor stocks to buy put options on now. ...
Despite rising gas prices, earnings reports from Visa and Starbucks suggest the consumer is still resilient. Will the weakness in the Consumer Discretionary sector change the narrative? Find out here. ...
Is a primary bear market developing in gold? Martin Pring analyzes the charts of spot Gold and Silver and shows two indicators that are pointing to a possible reversal. ...
Five of the Mag 7 stocks reported earnings and sent the broader market higher. One stock among the five stood out. Mary Ellen analyzes the stock and shows why it has potential to move higher. ...
Before We Dive In…
We already covered Market Summary basics in a previous article. So, in this installment, we’re going to talk about creating an ecosystem—wiring together all of the parts to make an even more powerful and customizable tool for your workflow. We can also make this ...
As a StockCharts Member, you unlock all of our most powerful tools and features, including saved charts and settings, custom scans, technical alerts and much more. Discover all that StockCharts can do with our
free 1-month trial and start charting like a true market pro.