When the stock market keeps grinding higher, it gets harder and harder to become bearish.
Just look at how the market closed on Friday!
S&P 500 ($SPX): 7,398.93 (+0.84%)
Nasdaq Composite ($COMPQ): 26,247.08 (+1.71%)
Dow Jones Industrial Average ($INDU): 49,609 (+0.02%)
The Nasdaq and S&P 500 notched record closing highs, again.
Of course, the higher the market climbs, the louder the question becomes: How much longer can this rally last? The reality is that nobody knows. This is why, as investors, our job isn’t to predict the market’s next move, but to follow the evidence, stay with the trend, and be alert to what’s happening beneath the surface.
One of my favorite ways to do that is with breadth, specifically the percentage of stocks moving above key moving averages.
On the Market Summary page, which is often my starting point for market analysis, the Breadth panel gives you a quick look under the hood.
Click the Moving Average tab, and you’ll notice that one thing stands out. Small caps are showing stronger breadth expansion than the major large-cap indexes.
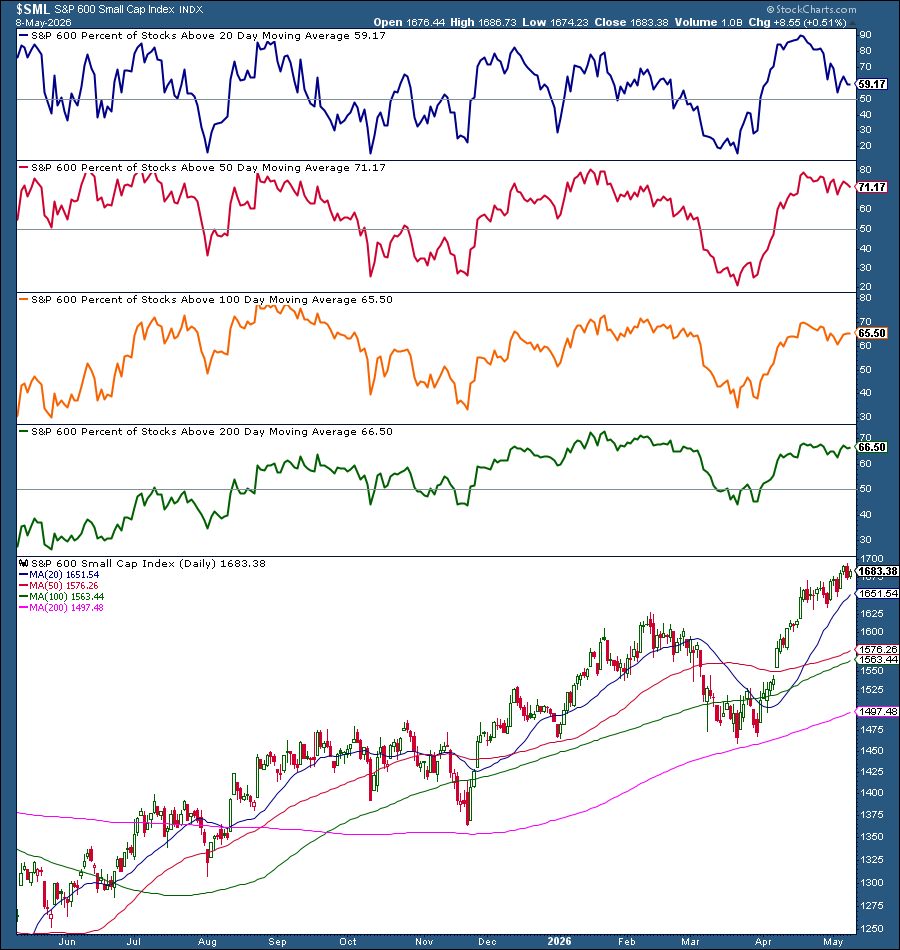
When you click on S&P 600, you’ll see a chart of the percentage of S&P 600 stocks trading above their 20-, 50-, 100-, and 200-day moving averages (see chart below). Right now, all readings are above 50%, which is a bullish sign.
Now compare that with the S&P 500 and Nasdaq. You’ll notice that breadth isn’t expanding quite as strongly there.
This is interesting at a time when large-cap semiconductors are getting all the attention. Names like Sandisk (SNDK), Micron (MU), and Intel (INTC) have been dominating the headlines. But after looking at the moving average breadth charts, it may be worth diving deeper into the small-cap universe.
A quick visit to MarketCarpets helps confirm the price action in small caps. Filter by the S&P 600 group and view the weekly performance. You’ll find that many of the strongest small-cap movers are also technology stocks. They just aren’t the Mag 7 names everyone is talking about.
If the broader trend remains strong, small-cap tech may be an area worth exploring for potential setups.
Still, it’s understandable to be cautious. Buying into a market at record highs can feel uncomfortable. That’s where options can become a helpful trading vehicle. With options, you can structure defined-risk trades that align with your risk-tolerance level. The challenge is to find them.
Next week, Tony Zhang, Chief Strategist at OptionsPlay, is hosting a free virtual event to show you how to find optimal options setups.
What: “Why 85% of Options Traders Burn Out (And the 60-Second Fix)”
No one knows how much higher the stock market can go, but with the right tools, you can approach your next trade with a clear plan, a defined risk level, and a sense of how much you can potentially gain or lose before you enter a position.
Technology stocks are once again dominating market performance, led by semiconductors and improving software charts. Dave Keller, CMT, uses breadth indicators, relative strength ratios, and sector ETFs to assess the sustainability of the 2026 tech rally and the warning signs to watch. ...
Investors are looking beyond AI and mega-cap tech as select retail and consumer stocks show strength. Here's where earnings momentum is broadening. ...
Stocks continue to surge with SPY, QQQ, and the Technology sector leading the market higher. Arthur Hill analyzes new highs in the S&P 500, bullish continuation pattern in RSP, and reversals in cybersecurity and cloud ETFs. ...
Before We Dive In…
Many traders spend too much time flipping through charts to find the right setup. Sometimes, they’ll find something that looks good, while other times, they get a bunch of duds. But what if that process was backwards? Instead of searching for stocks, what if you ...
Despite Thursday's selloff, stocks remain bullish. Consumer sentiment, oil prices, and Friday's jobs report will test the market's risk-on momentum. ...
A broadening rally can tempt investors into buying stocks that are already overstretched. Here's how you can safely identify the next market leaders and apply a risk-defined options strategy with a favorable risk-to-reward ratio. ...
European stocks are showing signs of improving technicals. A price gap, possible bull flag, rising 200-day moving average, and an RSI that's holding ground all point to potential bullish action. ...
With cybersecurity becoming ever more important to daily life -- trading being no exception -- Gatis starts off a three-part series on the topic by looking at the big picture. ...
As a StockCharts Member, you unlock all of our most powerful tools and features, including saved charts and settings, custom scans, technical alerts and much more. Discover all that StockCharts can do with our
free 1-month trial and start charting like a true market pro.
Because Percentage Price Oscillator (PPO) values are calculated as a percentage of price, you can compare the PPO values of stocks even if they differ greatly in price.