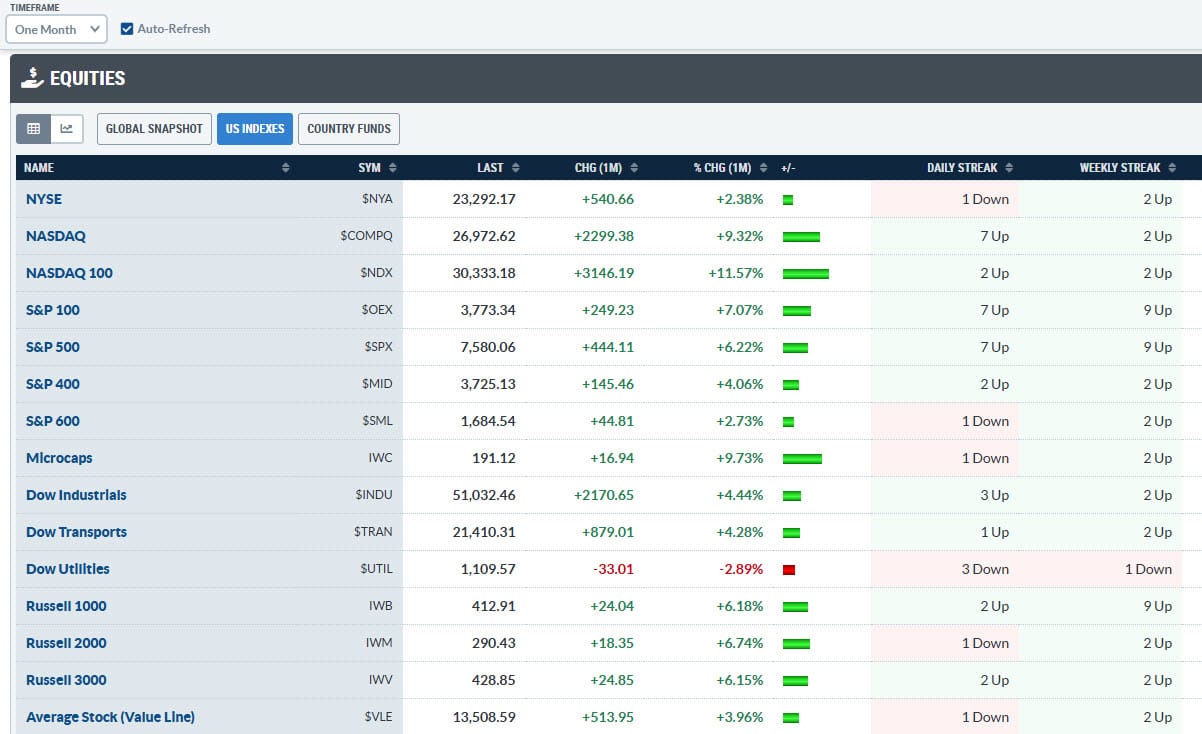
How stellar? Just head over to the Market Summary page, switch to the monthly timeframe, and look at the gains in the Equities panel. The only group in the red was Dow Utilities. Even more impressive is the Weekly Streak column: the S&P 100 ($OEX), S&P 500 ($SPX), and the Russell 1000 (IWB) have now logged a whopping nine straight up weeks.
The S&P 500 gained 6.22% in May, well above its 3.27% average over the last five years. If you follow the StockCharts Seasonality chart, you already know that the old “Sell in May and go away” adage hasn’t exactly been the wisest strategy.
Like the S&P 500, the Nasdaq Composite ($COMPQ) and Dow Jones Industrial Average ($INDU) also closed at record highs, with the Dow closing above 51,000 for the first time. Clearly, optimism is running high, driven largely by AI-related stocks and strong quarterly earnings.
The Cboe Volatility Index ($VIX) is at 15.32, suggesting investors are complacent. The NAAIM Exposure Index (!NAAIM) is at 98.38, indicating that institutional investors remain extremely bullish.
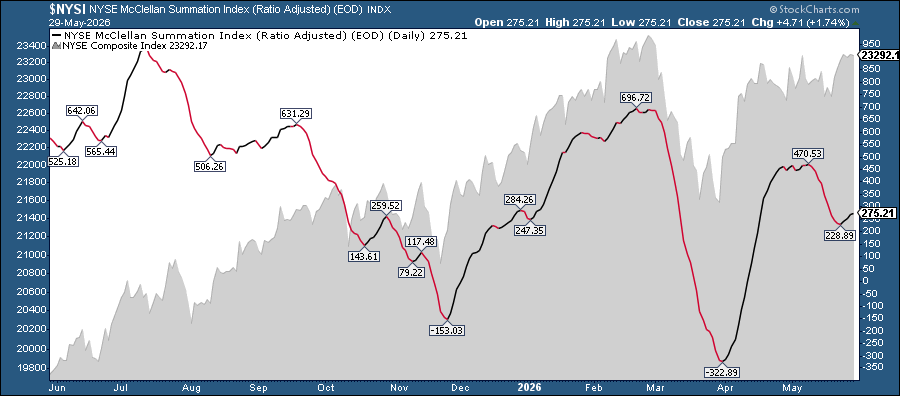
Individual investors, though, are leaning a bit more bearish. That’s why I’m keeping a close eye on two key market breadth indicators: the NYSE Advance-Decline Line (!ADLINENYA) and the NYSE McClellan Summation Index ($NYSI). Right now, both still point to expanding breadth (see chart of $NYSI below).
There isn’t much to dislike about this market. With this much investor enthusiasm, it makes sense to respect the price action and follow the trend. At the same time, this is when investors should pay attention to what’s happening beneath the surface.
Watch the fun unfold as Tom Bowley, Julius de Kempenaer, Grayson Roze, and Dave Keller go head-to-head and try to beat the star of the show, the StockCharts Technical Rank (SCTR) Team!
Before We Dive In…
You invested a lot of money into a bad stock, and you realized it too late. It plunged, and you've taken a huge loss. So, later, you buy a sizable position in a much stronger company. It pulls back, as all stocks do. You ...
Technology stocks are breaking out with strong follow-through. Arthur Hill analyzes charts of the cybersecurity, software, and Fintech ETFs and shows that they are displaying healthy breakout signals. ...
The S&P 500 remains in a strong uptrend, but two notable breadth indicators are flashing caution signals. Dave Keller, CMT, examines the Hindenburg Omen and Titanic Syndrome to assess whether weakening participation beneath the surface could signal a late-stage bull market environment. ...
Get a behind-the-scenes look at how technical analysts set up their game plan for Tom's Super Bowley Fantasy Stock Draft. Discover how they analyze the overall market, the strategies they follow, and how they pick sectors and stocks that will outperform the market. ...
So far, 2026 has been shaped by geopolitical upheavals, stellar earnings, and mini booms and busts. As we enter the summer months, investors should monitor the broad action and watch intermarket relationships between bond yields, crypto, precious metals, and oil. ...
Economic indicators can help you make trading and investing decisions. Martin Pring shows how you can use indicators to identify peaks and troughs in market cycles. ...
As a StockCharts Member, you unlock all of our most powerful tools and features, including saved charts and settings, custom scans, technical alerts and much more. Discover all that StockCharts can do with our
free 1-month trial and start charting like a true market pro.