On June 30, the final trading day of the second quarter, semiconductors looked ready to come roaring back. But by Thursday’s close, the last trading day of this holiday-shortened week, that comeback looked a lot less certain.
In this update:
Semiconductors flash red
Getting a head start before Monday's open
Health Care hits record highs
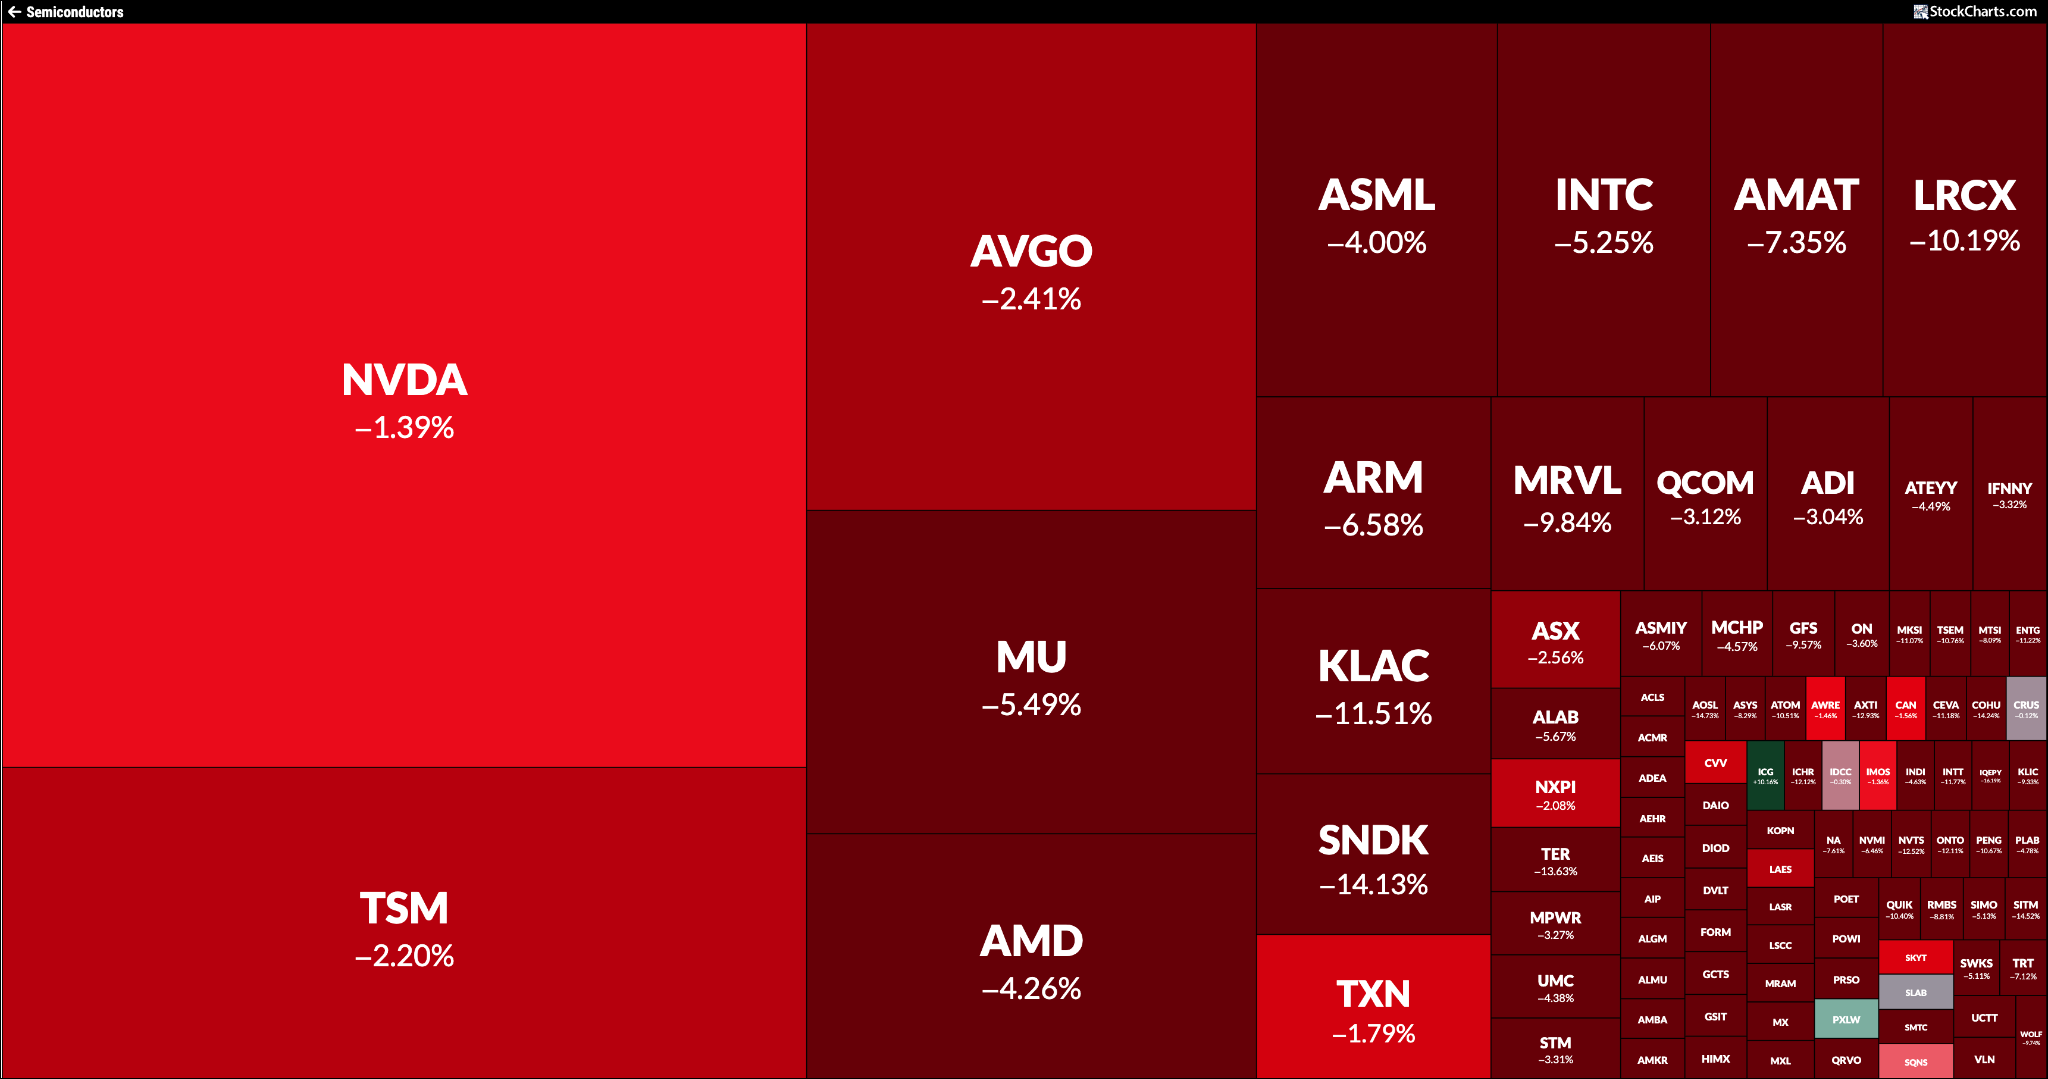
The MarketCarpet below tells the story pretty clearly. Semiconductors sold off sharply, and it was a sea of red across the group.
The VanEck Semiconductor ETF (SMH) fell 4.57% on Thursday and closed below its 21-day exponential moving average. It did manage to hold above its 50-day simple moving average, though.
What made Thursday’s price action interesting was that the weakness wasn’t broad-based. While technology stocks came under pressure, the Dow Jones Industrial Average ($INDU) closed at a record high, gaining 1.14%. Sector performance also leaned positive. Eight of the 11 S&P 500 sectors closed in the green. So, while semiconductors lost some momentum, investors aren’t abandoning stocks. They’re just rotating out of tech and into other areas.
Overall, the major indexes are still in long-term uptrends, breadth continues to expand, and sentiment is still bullish.
Get a Head Start
After Thursday’s close, I ran a few scans from our Sample Scan Library. One scan I like to run to confirm market strength is “Moved Above Upper Bollinger Band.” This scan returned 133 stocks, with Financials and Health Care making up a large portion of the list.
Health Care was the top-performing sector on Thursday, with the Health Care Select Sector SPDR (XLV) closing at a record high. If that momentum continues into next week, some of the Health Care stocks on this list, such as AbbVie (ABBV), Amgen (AMGN), and Gilead Sciences (GILD), could be worth monitoring.
Running your favorite scans before the market opens on Monday is a smart habit to build into your routine. It gives you a head start on where strength is showing up, where leadership may be shifting, and which charts are worth analyzing closely.
There are many ways to narrow your scan results. For example, if I’m only interested in the Health Care stocks, I would modify the scan criteria to include stocks in the Health Care sector. Just click the Edit Scan Criteria button, select Health Care from the Sector dropdown in the Scan Components panel, and add it to the Scan Criteria. After narrowing your list, you can save the scan results to a ChartList or view them in CandleGlance or SharpCharts formats.
The more often you run scans, the more engaged you become with the market. It’s a great way to prepare for the trading week or trading day ahead.
Our Support Center offers several educational articles to help you get more comfortable with the StockCharts Scan Engine. With the long weekend here, it may be a good time to explore them and sharpen your analytical skills.
Wishing everyone a safe and happy Independence Day!
The S&P 500 isn't forming a classic head-and-shoulders top. Dave Keller, CMT, explains why a symmetrical triangle better describes the current consolidation, highlights the key breakout and breakdown levels, and shows how trend models can help confirm the market's next move. ...
Stocks finished the first half strong, with semiconductors leading the way. Here's why the broader market trend remains bullish, and what investors should watch next. ...
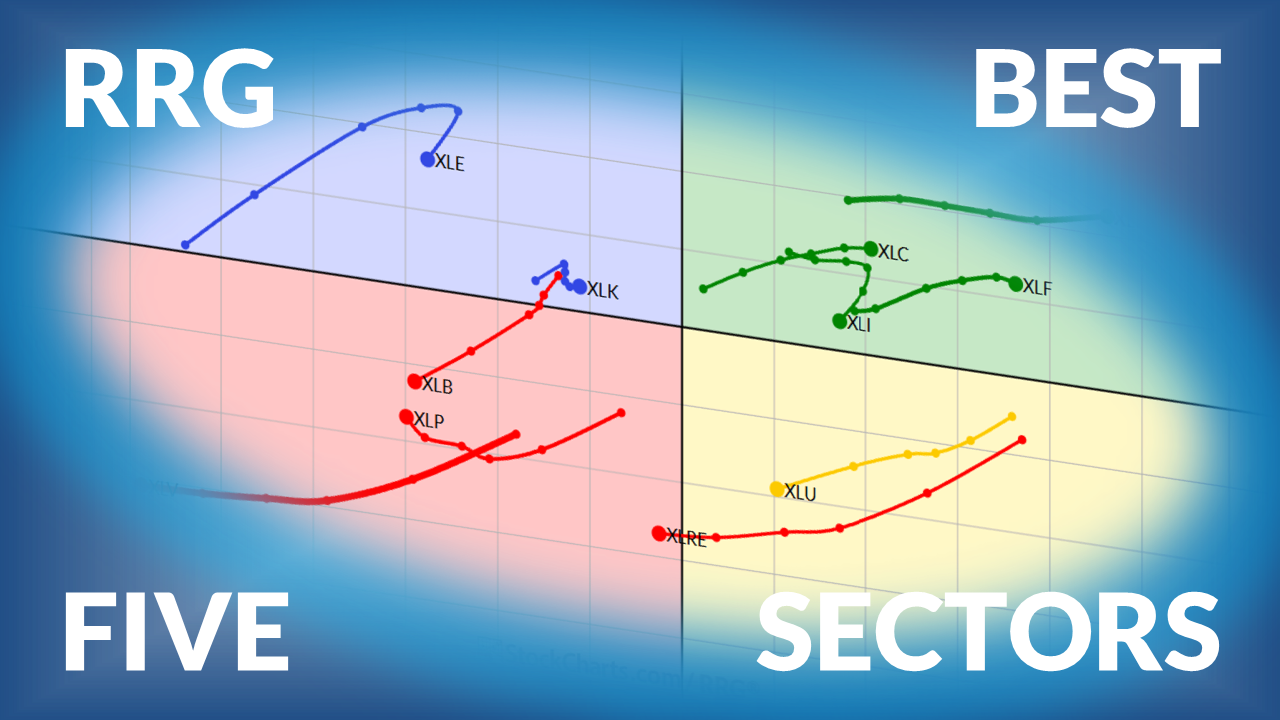
Julius de Kempenaer presents his weekly update on sector rotation using Relative Rotation Graphs®, as Financials enter the top five sectors while Energy falters. ...
As we approach the next earnings season, investors should keep an eye on stocks and the bond market. High-yield and investment-grade bond spreads are creeping higher. Here's one chart to monitor as we head into the second half of 2026. ...
With Treasury yields breaking lower, some market groups could gain a meaningful tailwind. Dave Keller, CMT, highlights why small caps, homebuilders, and real estate may benefit from falling rates, along with the technical signals supporting these emerging opportunities. ...
What can investors expect in the second half of 2026? There are some new trends emerging ahead of a Presidential Election Cycle stretch. Keep an eye on Treasury yields, energy prices, and large-cap tech stocks. ...
As a StockCharts Member, you unlock all of our most powerful tools and features, including saved charts and settings, custom scans, technical alerts and much more. Discover all that StockCharts can do with our
free 1-month trial and start charting like a true market pro.
The "Horizontal Line" overlay can be used to mark key price levels for your active trades or investments. For instance, use a green Horizontal Line to mark a position's cost basis directly on the chart, and a red Horizontal Line to mark your stop loss.