The stock market ended the week on a positive note, despite the mid-week selloff, thanks in large part to the excitement surrounding the Nasdaq debut of SK Hynix (SKHY or SKHYV), reigniting enthusiasm for the AI trade.
This week’s update:
Earnings season kicks off
Your ChartLists page
An upcoming OptionsPlay live event
Technology stocks are now back in the spotlight. Semiconductors and the Mag 7 have come out of hibernation, giving the broader market a much-needed boost. The S&P 500 ($SPX), Nasdaq Composite ($COMPQ), and Dow Jones Industrial Average ($INDU) are all trading above their 21-day exponential moving averages (EMAs).
Earnings Season Kicks Off
Next week, attention turns to big bank earnings. The KBW Bank Index ($BKX) remains in a solid uptrend and is outperforming the S&P 500 by 7.70%. It’s also just decimal points away from its record close, which means expectations are elevated. Now, the banks have to deliver.
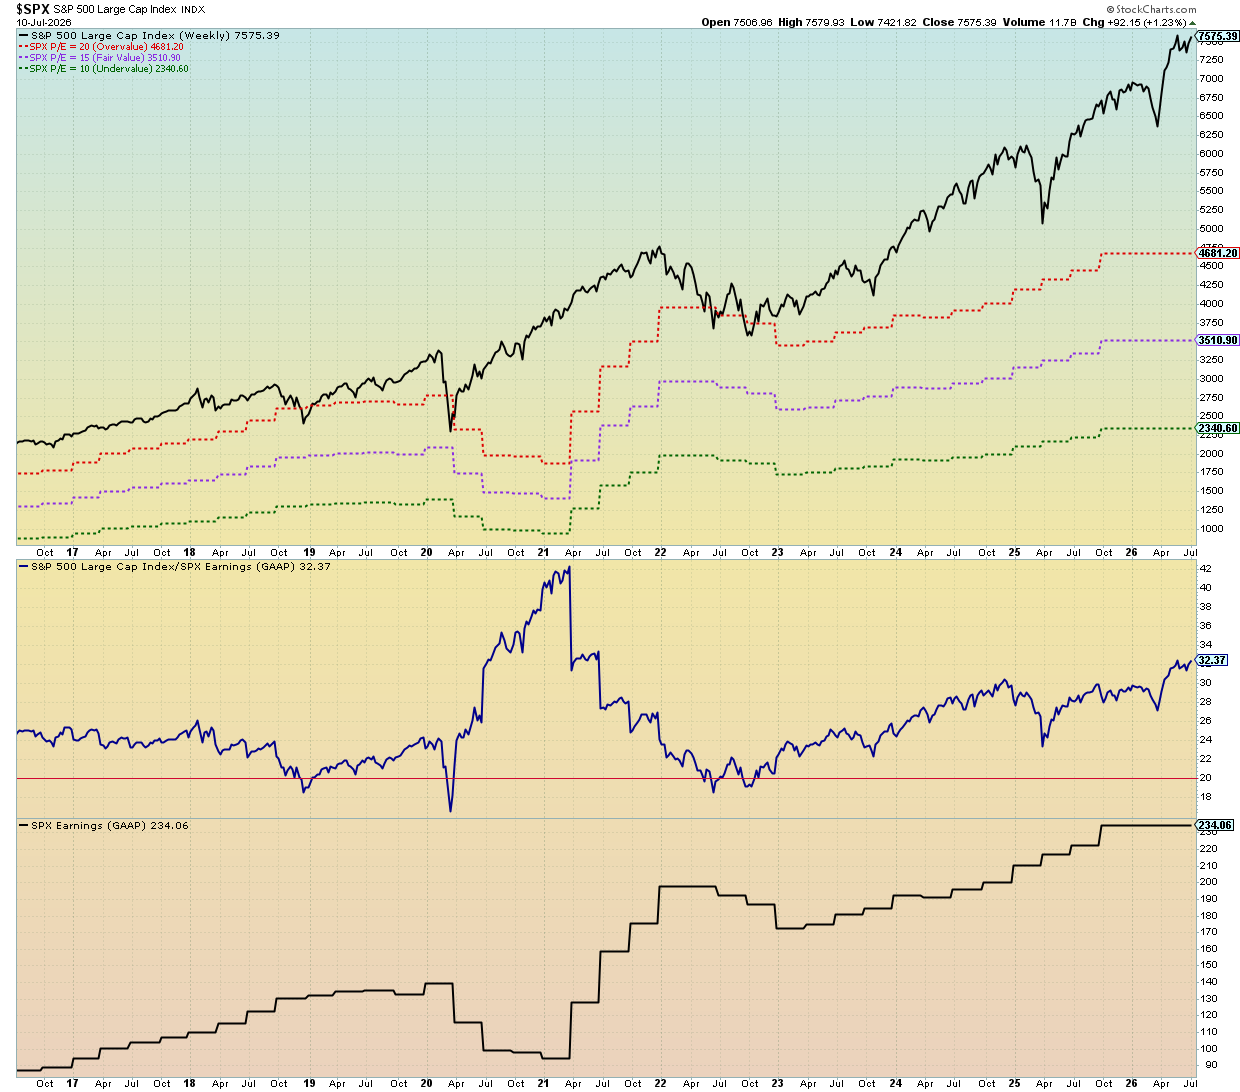
The same is true for technology stocks and the broader market. With the S&P 500 approaching its all-time high, strong earnings from banks and mega-cap tech companies could provide the next push higher. The chart below shows just how strong earnings have been.
Earnings season is always an exciting time for investors, but it can also be overwhelming. With so many companies reporting, it’s important to stay organized. One way to prepare is by setting up scans during earnings season. You can always check upcoming earnings using our Earnings Calendar, but setting up a scan is so much faster. It also gives you more time to catch some World Cup and Wimbledon action.
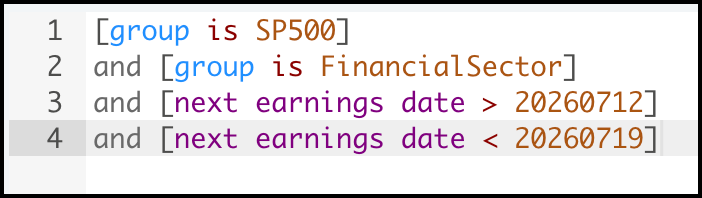
Since big banks will be the main focus next week, you could run a simple scan such as this:
When I ran the scan, it returned 18 stocks. I saved the results to an “Earnings” ChartList, where I can monitor how each stock performs after its earnings announcement.
Your ChartLists Page
This week, StockCharts introduced the Your ChartLists Page. Now, when you click the ChartLists button, your ChartLists will open in a dedicated page. It’ll look familiar, but there are a few subtle improvements.
For example, before my Earnings scan runs again next week, I can empty the ChartList in one quick step. It will then be ready for the next batch of scan results. I will need to update the scan to include other industry groups, since most of the banks will have finished reporting by then. It’s a little bit of work, but it's a lot more efficient than reviewing every stock manually.
Scans are incredibly flexible and can streamline your decision-making process, not only for stocks but for options as well. Options traders know how time-consuming it can be to identify the underlying security and then choose a strategy.
OptionsPlay Live Event
If you trade options or are interested in learning, consider attending an upcoming live event hosted by OptionsPlay. You’ll learn how to build a structured, defined-risk strategy using a workflow you can repeat daily.
What: Find Explosive Options Trades In Under 60 Seconds
A stock isn't in a new uptrend until resistance is broken and the breakout is confirmed. Dave Keller, CMT, reviews DASH, XAR, and QTUM to show how price and momentum can validate the next accumulation phase. ...
Chip stocks rally as Big Tech shows signs of life, oil pulls back, and Bitcoin firms up. Can renewed risk appetite push the S&P 500 toward new highs? ...
Interest rates are rising, which could be a headwind for equity gains. Mike Zaccardi explains why investors should keep an eye on a particular chart as yields continue rising. ...
Fibonacci retracements help investors identify high-probability support, resistance, and price targets. Dave Keller, CMT, uses NVIDIA and Adobe to demonstrate how selecting the right swing highs and lows creates a disciplined framework for anticipating market turning points. ...
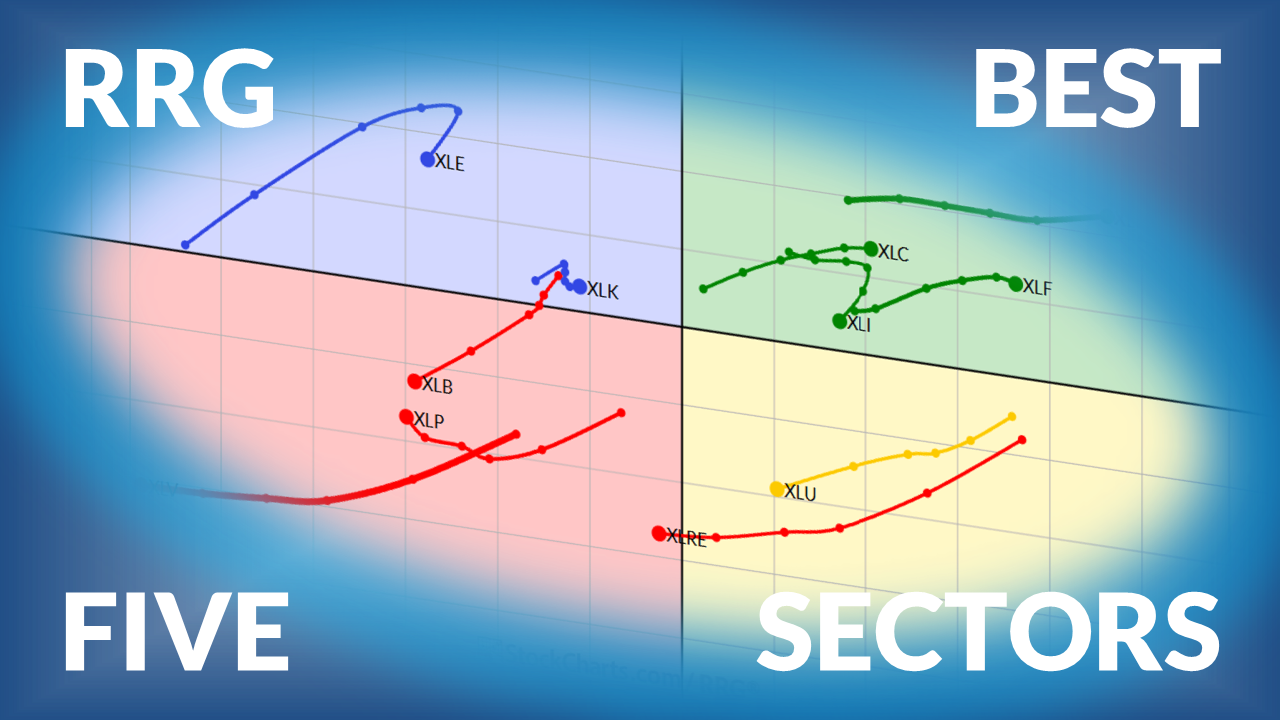
Julius de Kempenaer presents his weekly update on US sector rotation using Relative Rotation Graphs, noting Health Care's big jump and Technology's slowing momentum. ...
Will the Fed raise interest rates a couple of times this year? Martin Pring analyzes charts of the 2-Year US Treasury Yield Index from different perspectives. Find out what the charts reveal. ...
The Financials sector has been gaining strength ahead of the big bank earnings. Here's a deep dive into charts of financial ETFs and stocks so you can identify where the opportunities lie. ...
Before We Dive In…
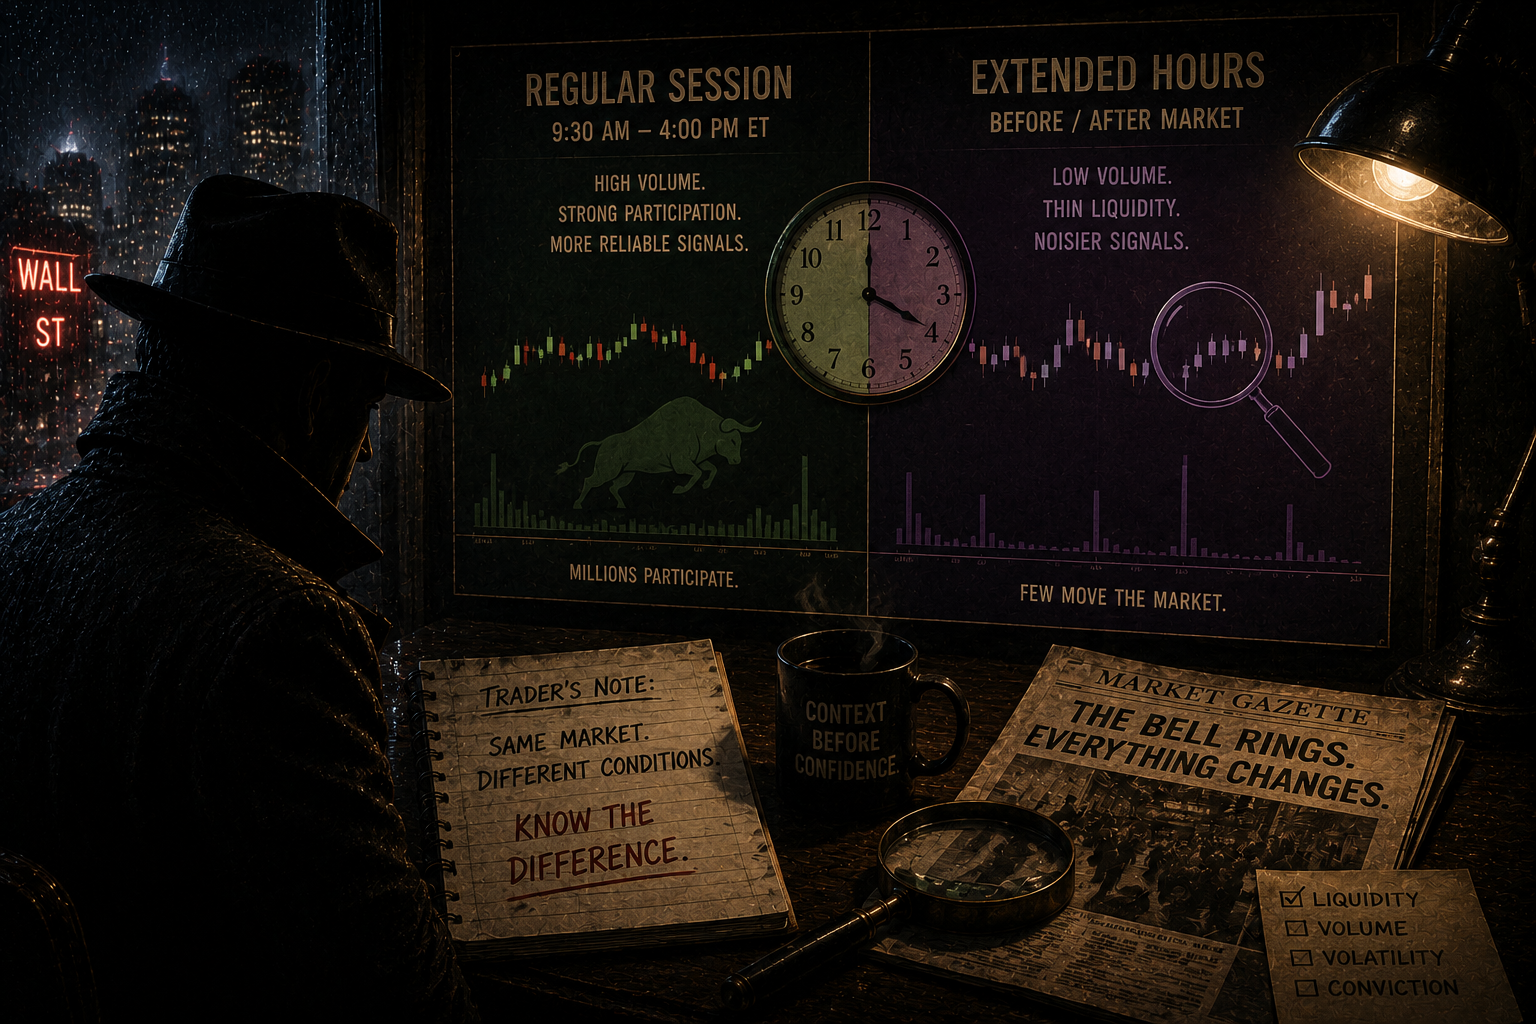
Indicators are designed to help you perceive certain market dynamics more clearly. But first they have to consume data: Price. Volume. These are key ingredients. Extended hours trading changes the recipe. Volume vanishes. Thin trading distorts calculations. Momentum gets magnified. Trends look different.
The math is ...
As a StockCharts Member, you unlock all of our most powerful tools and features, including saved charts and settings, custom scans, technical alerts and much more. Discover all that StockCharts can do with our
free 1-month trial and start charting like a true market pro.