It was a rough week for the stock market, despite a strong start to quarterly earnings season. Technology stocks came under pressure, oil prices continued to rise, and the Cboe Volatility Index ($VIX) jumped 12.19%, closing at 18.77.
With so much uncertainty in the market, the weekend is a good time to look past the headlines, narrow your focus, and prepare for what could come next. Here’s where StockCharts' new Screener tool can help.
This week’s update:
Explore the new StockCharts Screener
Save 20% with our Summer Special
When you log in to StockCharts this weekend, you may notice a new Screener button on your dashboard. It’s still in beta, and we’d love for you to take it for a test drive and share your feedback.
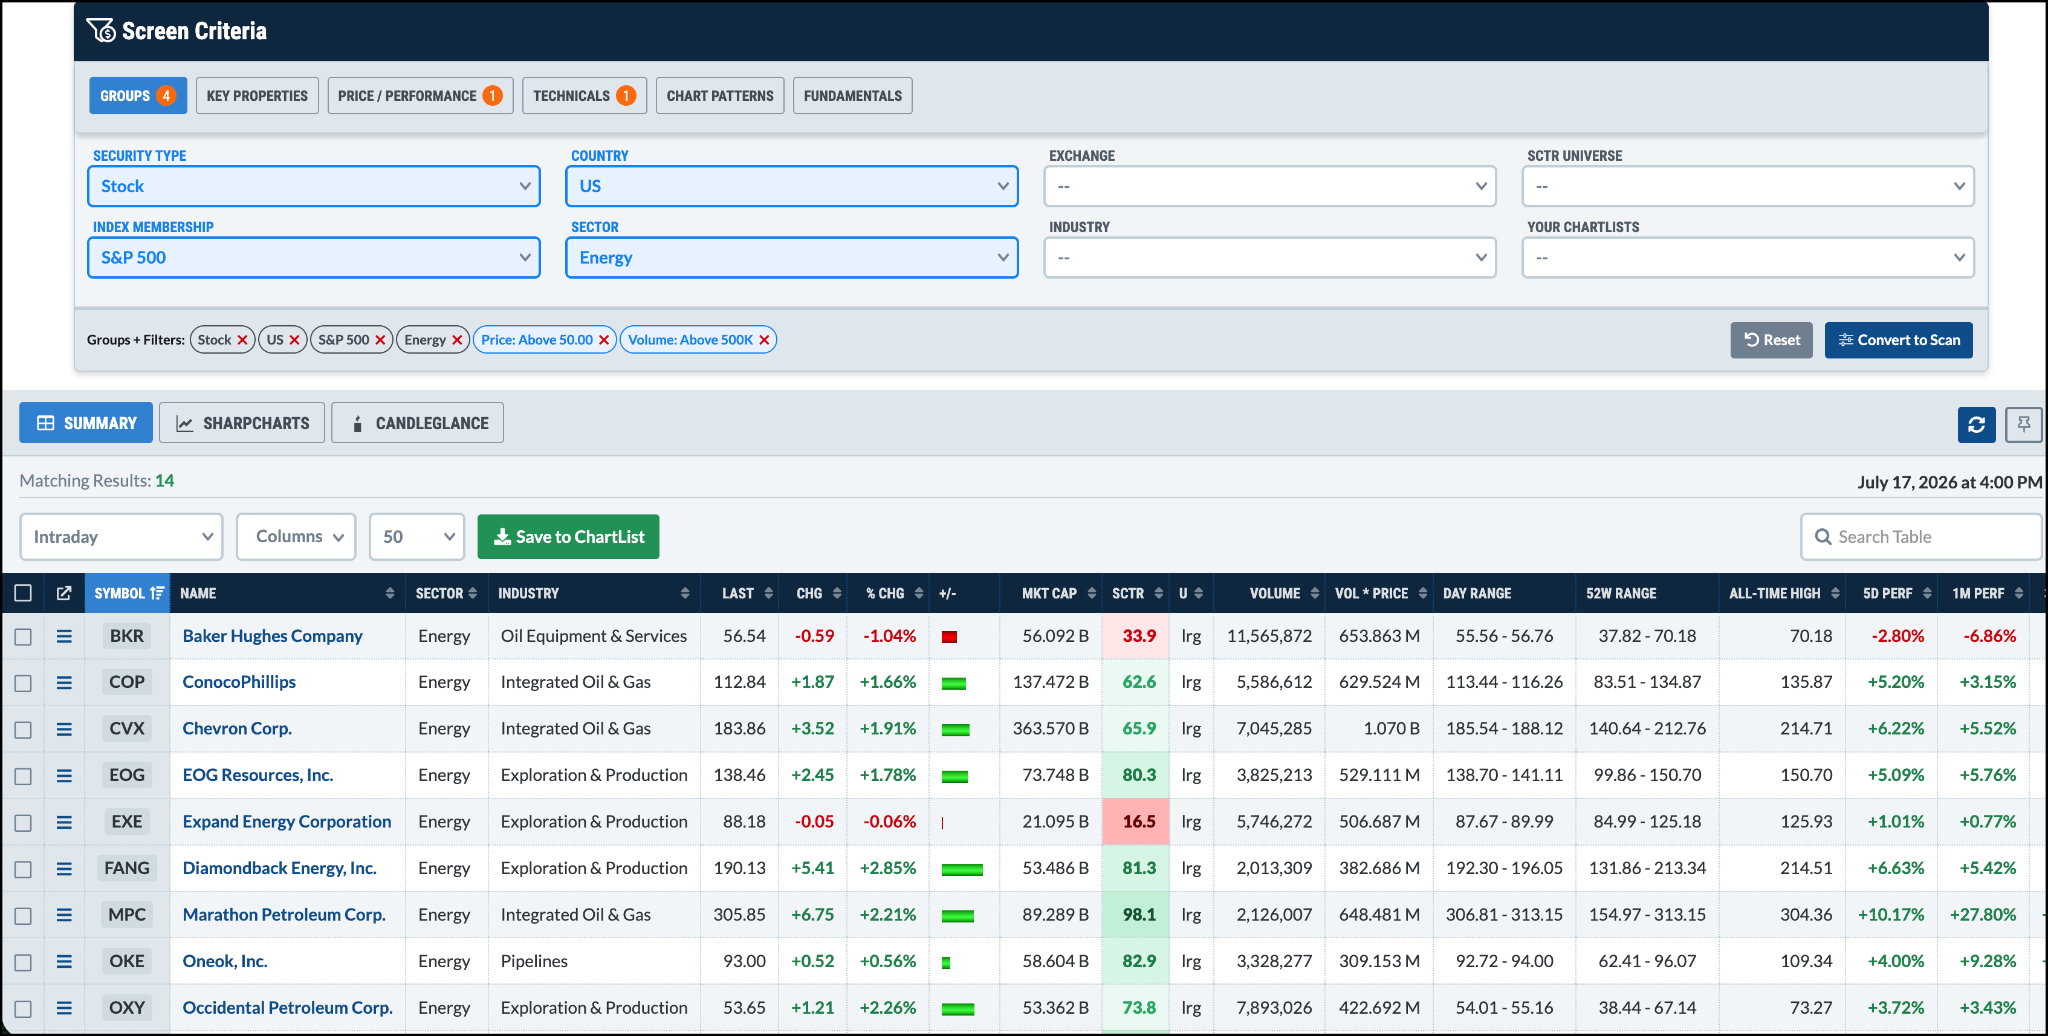
So, what can you do with the Screener? With it, you can move from a broad market view to a focused list of stocks that match your criteria. You’re probably thinking, “Couldn’t you already do that?” And while the answer is yes, the Screener allows you to do it a lot faster, and a little differently.
Here’s one of the best parts about the Screener. Once you’ve built a screen, you can turn it into a custom scan by just clicking the Convert to Scan button. It's a simpler method for creating more advanced scans without having to build one from scratch.
The screening criteria are organized into different categories: Groups, Key Properties, Price/Performance, Technicals, Chart Patterns, and Fundamentals. Within each category, there are plenty of ways to further refine your results. As you select your criteria from the dropdown menus, you’ll see them listed along the bottom of the Screen Criteria panel. This gives you a real-time view of how your screen is created.
You can also save your screens, which means you can build different setups for different market environments. For example, one screen may help you find growth stocks in an uptrend, while another could help you find stocks with strong fundamentals, and another could find stocks that are breaking out.
Below the Screen Criteria, you’ll see a list of all the matching results. You can review them in Summary, SharpCharts, or CandleGlance view. From the Summary view, you can select the symbols you want to save directly to a ChartList. The screenshot below gives you a preview of the new Screener.
Spend some time exploring the different combinations. Once you cozy up to it, you may find the Screener becoming a valuable part of your market analysis routine.
And remember, the Screener is just one of the many tools available in StockCharts. There are many more available for you to utilize, such as advanced charts, scanners, alerts, and ChartLists that can help you stay organized and prepared.
Our Summer Special makes this a great time to put all those tools to work. Beginning July 18, you can save 20% off a 6- or 12-month StockCharts subscription or renewal, whether you’re joining for the first time or extending your current membership. But the offer is only available for a limited time, so be sure to take advantage of the savings while they last.
Julius de Kempenaer presents an analysis of sector rotation out of technology and semiconductor stocks and examines how this may impact the S&P 500 index. ...
The S&P 500 remains locked in a consolidation phase, but that won't last forever. Dave Keller, CMT, outlines four possible market scenarios through the end of August, explaining the technical signals, sector rotation, and macro drivers that could shape the next major move. ...
Should you rely on AI models to pick your stocks? Discover the pitfalls of relying on AI decisionmaking when trading — and how the tools offered by StockCharts.com can help you make your own best choices. ...
Earnings season can show early signs of weakness emerging beneath the stock market's surface. Here's how you can identify which equities, sectors, and ETFs have deteriorating momentum. ...
Before We Dive In…
It’s easy to get too caught up in the present. Especially when it comes to investing. You’ve got news headlines, economic reports, current price moves, and just about everything to distract from what matters most: context. This is an exploitable blind spot, and not ...
Longer-term momentum in gold and silver prices points to a long consolidation or bear market. Martin Pring analyzes the charts of both metals and discusses the potential for a relief rally. ...
As semiconductor leadership fades, financial stocks continue to strengthen. Dave Keller, CMT, analyzes Morgan Stanley, Bank of America, and Wells Fargo, highlighting technical patterns, support levels, and momentum signals that could drive further leadership in the sector. ...
As a StockCharts Member, you unlock all of our most powerful tools and features, including saved charts and settings, custom scans, technical alerts and much more. Discover all that StockCharts can do with our
free 1-month trial and start charting like a true market pro.
With the three indicators included in our Relative Volume plug-in for StockChartsACP, you can easily pinpoint high or low volume moves for the securities you're watching. The indicators display volume data relative to a customizable average of your choosing in different visual orientations. You can even adjust the baseline to easily zero in on more extreme volume moves.