Earnings, tariffs, oil prices, and Treasury yields gave investors plenty to digest this week. By Friday’s close, the S&P 500 ($SPX), Nasdaq Composite ($COMPQ), and Dow Jones Industrial Average ($INDU) had all closed lower for the week, with the Nasdaq taking the biggest hit.
This week’s update:
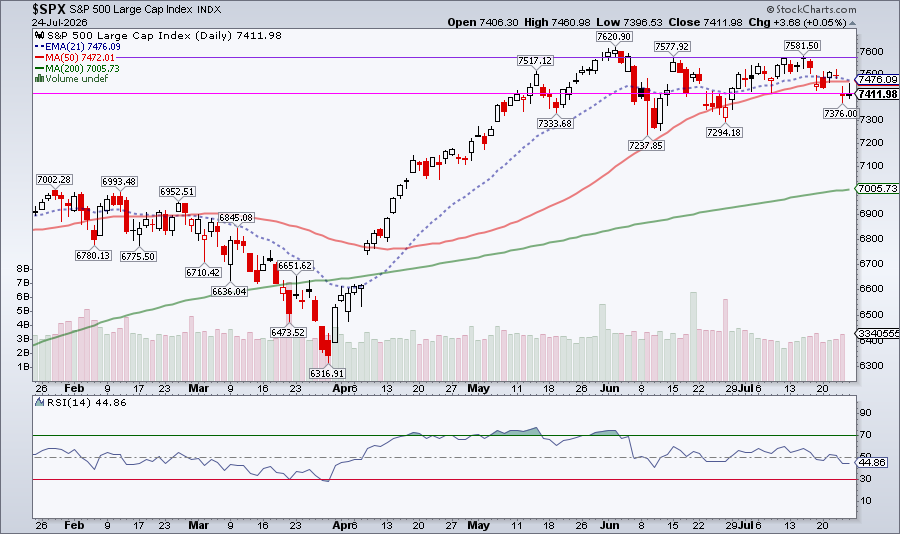
S&P 500 tests short-term support level
How to get more from the StockCharts Screener
A final reminder about our Summer Special
The S&P 500 is now sitting at the first short-term level I’m monitoring on the daily chart. With the index staying at relatively similar points over the past two sessions, the market isn’t offering many clues about what could come next.
That kind of indecision can make preparing for the week ahead especially challenging. And with earnings from four of the Mag 7 stocks and a Fed meeting on the calendar, we could be in for some volatile days ahead. How do you prepare for what could be a possible roller coaster week?
In this environment, maybe you’d rather focus on dividend-paying stocks that offer some stability. Alternately, you might find you'd rather look for stocks in sectors that are showing strength. Or perhaps you want a list of stocks that are reporting earnings next week, so you can take advantage of the post-earnings move?
The challenge is narrowing thousands of stocks and ETFs down to those that fit your investing style. This is where the StockCharts Screener can help.
We introduced the Screener in last week’s newsletter, and this week we’re taking a closer look. In a new video, Grayson Roze, our Chief Strategist, walks through practical tips and creative ways to use the tool. So grab some popcorn, pour yourself a cold beverage, click the image below, and enjoy the video.
Whether you’re looking for stocks that are pulling back, or strong stocks in leading sectors, upcoming earnings, or dividend-paying stocks, the Screener can help you build a more focused ChartList. Explore the possibilities, experiment with different filters, and head into next week with a plan.
One More Thing …
Our Summer Sale ends on Sunday, July 26. If you’ve been thinking about joining the StockCharts community, renewing your membership, or adding more time to your current plan, this is a good opportunity to save 20%.
Earnings season is in full swing and, as expected, results were mixed. Tom Bowley looks at four stocks of companies that have reported earnings, and discusses one indicator you should review ahead of earnings reports. ...
When a stock falls below its 50-day moving average but remains above its 200-day moving average, the next move often determines the longer-term trend. Dave Keller, CMT, explains this "moving average limbo" pattern, using Alphabet, MDY, and Broadcom to identify key technical signals. ...
Out of the 11 S&P 500 sectors, Utilities is showing the strongest breadth. Arthur Hill does a top-down analysis starting with the sectors, then focuses on the chart of XLU. ...
With mega-cap tech earnings on deck and a Fed meeting in July, there are some technical warning signs emerging. Here's one chart all investors should be monitoring closely. ...
Are consumers spending on discretionary goods, or are they more cautious? Martin Pring analyzes the ratio of consumer discretionary to consumer staples stocks and provides insight into what could be a likely scenario. ...
As semiconductor stocks are retreating, China ETFs are displaying strengthening relative strength. Could it be an opportunity to diversify your portfolio during the second half of the year? ...
As a StockCharts Member, you unlock all of our most powerful tools and features, including saved charts and settings, custom scans, technical alerts and much more. Discover all that StockCharts can do with our
free 1-month trial and start charting like a true market pro.