What a week! One day, the major indexes look ready to slide lower; the next day, they reverse course and end the week on a positive note.
This week’s update:
Wild stock market swings
Scanning for strong stocks
Level up your scanning skills
If you’re a short-term trader, this past week probably tested your patience. Earnings from four Mag 7 companies triggered sharp price swings, semiconductors sold off and then rebounded, and investors had to digest a Fed meeting, inflation data, and a yen intervention.
Even longer-term investors may have felt uneasy. By Friday’s close, though, the S&P 500 ($SPX), Nasdaq Composite ($COMPQ), and Dow Industrials ($INDU) posted weekly gains.
Earnings, economic data, and unexpected headlines will always influence the stock market. Instead of letting that noise drive your decisions, focus on finding opportunities that match your investment criteria.
How do you narrow the field when you have thousands of stocks to choose from?
The Screener can help narrow the field
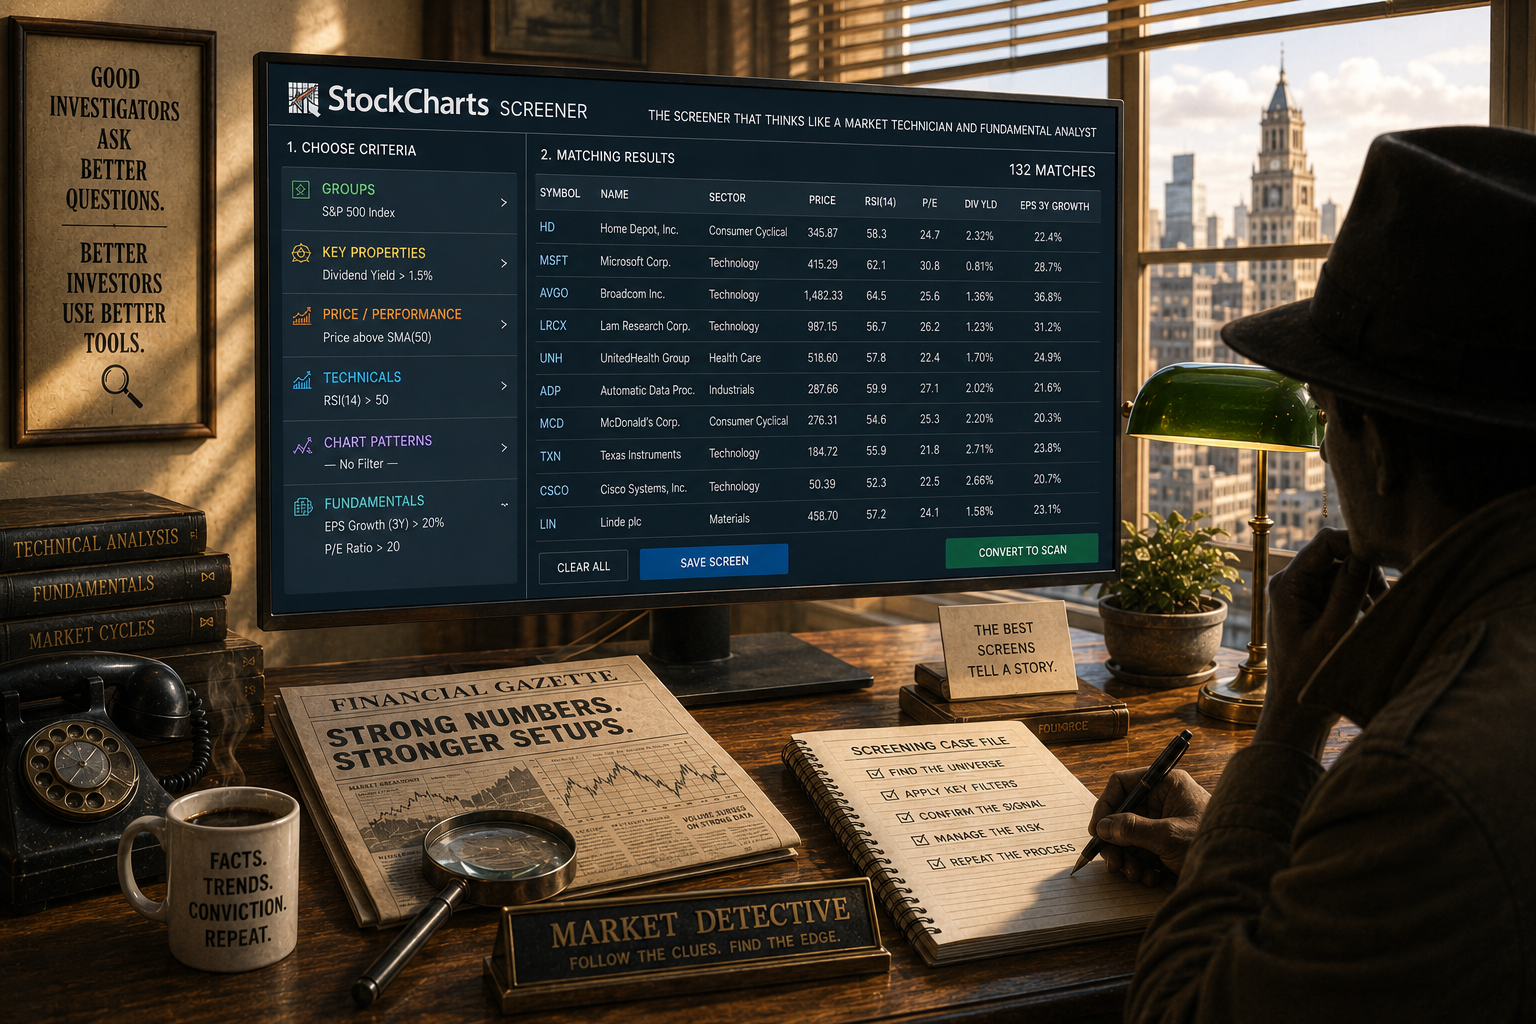
With several large-cap earnings reports behind us, I used the StockCharts Screener to search for S&P 500 companies with strong fundamentals.
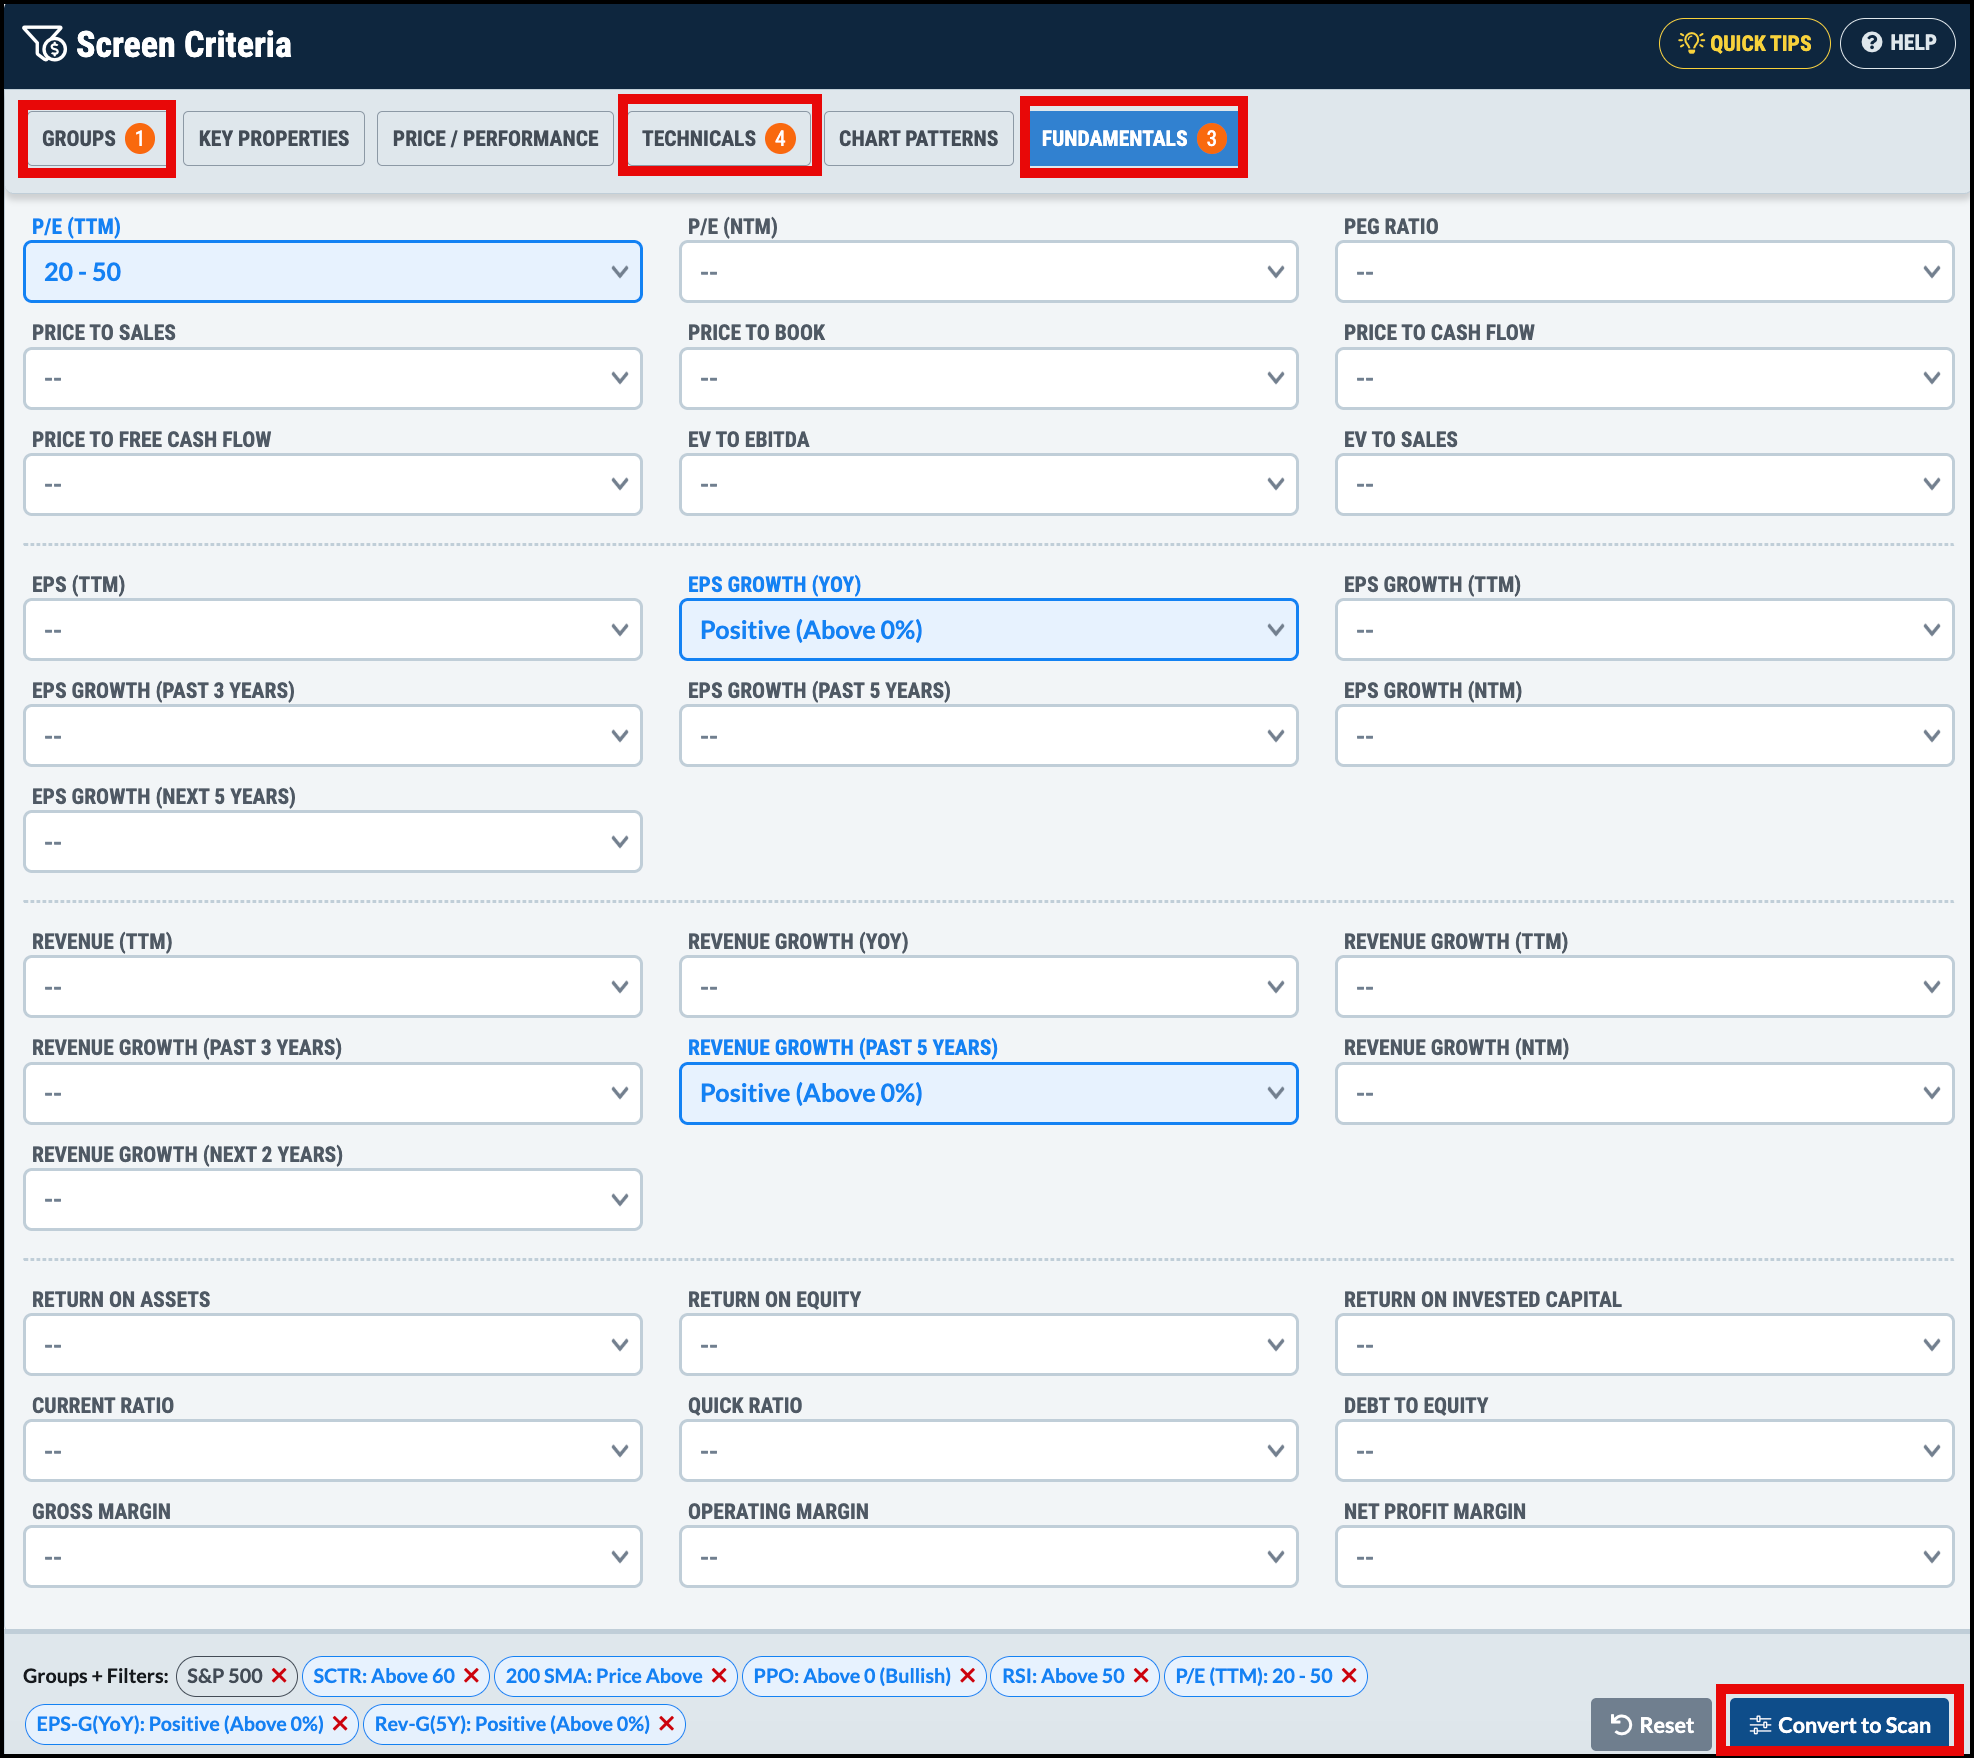
I began by selecting the S&P 500 in the Groups tab. Then, under the Fundamentals tab, I selected positive year-over-year EPS growth, positive revenue growth, and a P/E ratio between 20 and 50.
Strong fundamentals are a good starting point, but they don’t complete the picture. I also want to find stocks that are in established uptrends and showing positive momentum. I narrowed the results further by looking for stocks trading above their 50-day simple moving average, with a Percentage Price Oscillator (PPO) above zero, a Relative Strength Index (RSI) above 50, and a StockCharts Technical Rank (SCTR) score above 60. The Screener reduced the large universe of stocks to less than 50, a more manageable list of potential investment candidates.
Level up your scan
You can take the process a step further. Suppose you want to find stocks with an RSI between 50 and 70. Click the Convert to Scan button and add the following conditions into your scan:
and [Daily RSI(14,Daily Close) > 50] and [Daily RSI(14,Daily Close) < 70]
Here’s a useful tip: Before running your scan, click the Reformat and Check Syntax buttons. This will help spot any issues before you review the results.
Once you’re satisfied with the scan, save it and run it whenever you like. You can also continue refining it by returning to the Screener or editing the scan conditions.
The StockCharts Screener is a great starting point for finding stocks that meet your specific requirements. And now, you don't have to leave StockCharts or rely on another site to screen for ideas. You can research the market, screen for stocks, and review the charts all in one place.
Think about the qualities you value most in a stock. Then put those ideas into the Screener, review the charts, and find your next investment opportunity.
With market breadth improving, the S&P 500 has potential for an upside breakout. Arthur Hill analyzes market breadth indicators and shows why an upside breakout is possible in the SPY. ...
Before We Dive In…
There are times when you want to find tradable securities based on a simple premise. You want stocks or ETFs in certain groups exhibiting a few key technical and fundamental characteristics. What you don’t want to do in this early stage is to craft a ...
The S&P 500 remains trapped in a trading range, but market breadth tells a more nuanced story. Dave Keller, CMT, reviews key breadth indicators to explain what's supporting the bull market, where warning signs remain, and what would confirm a more bullish outlook. ...
Stocks, bonds, and volatility send warning signals after the Fed meeting. Here are the key support levels and market catalysts traders should watch next. ...
Growth stocks may be out of favor, but now might not be time to give up on them. Here's one key price point in the chart of IWF that could determine whether or not growth stocks regain their leadership. ...
While oil prices are cooling off, wheat, soybean, and corn prices may be getting ready to take off. Martin Pring analyzes the charts of the agricultural complex and shows you the price levels to monitor. ...
As a StockCharts Member, you unlock all of our most powerful tools and features, including saved charts and settings, custom scans, technical alerts and much more. Discover all that StockCharts can do with our
free 1-month trial and start charting like a true market pro.