It looked like we might get a little excitement this week after Thursday’s price action, but that ultimately never materialized, and Friday turned out to be a quiet session. Even so, the S&P 500 ($SPX) and Nasdaq Composite ($COMPQ) eked out a small gain for the week.
This week’s update:
Stock market hits new highs
Scanning for strong stocks
EarningsBeats live event
Stocks Finish Strong
When the market is making new highs, adding long positions can feel tricky. Maybe stocks are topping out and due for a pullback in the next week or two. Does it make sense to buy now, or is it better to wait? Then again, what if the market keeps climbing and you miss the opportunity? These are the kinds of questions that tend to surface when the major indexes are trading near record highs.
Next week could be quiet as well, short of any unexpected news headlines. We’ll get earnings from a few retailers, but there are relatively few major economic data releases on the calendar. So how should investors prepare?
Scan For Strong Stocks
One scan I’ll be revisiting is my SCTR Scan, which looks for large-cap stocks with a SCTR score crossing 76, 78, or 80. But what exactly is SCTR? That acronym refers to the StockCharts Technical Rank (pronounced S-C-O-O-T-E-R), which assigns stocks a numerical rank from 0 to 100. The higher the score, the stronger the stock. There’s a lot more behind the ranking system, so if you’d like to dig deeper, check out the ChartSchool article dedicated to SCTR.
👉 Here's the SCTR Scan I use to find large-cap stocks crossing above key SCTR levels. [country is US] and [sma(20, volume) > 100000] and [[SCTR.large x 76] or [SCTR.large x 78] or [SCTR.large x 80]]
Stocks crossing above SCTR levels of 76, 78, or 80 are showing improving relative and technical strength, which can be a sign that there’s more upside ahead. When I ran the scan after Friday’s close, 25 stocks made the cut. Of those, seven stood out enough to add to my watchlist: Citigroup (C ), J.P.Morgan Chase (JPM), Lattice Semiconductor (LSCC), NVIDIA (NVDA), Pinterest (PINS), Charles Schwab (SCHW), and Occidental Petroleum (OXY).
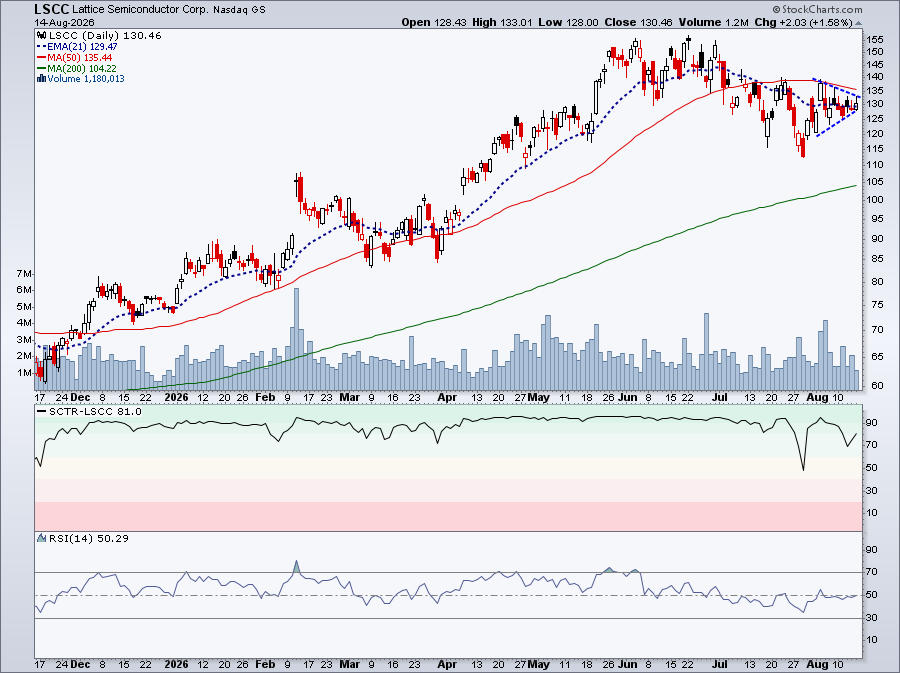
They’re all interesting charts, but the one I will be watching most closely is Lattice Semiconductor.
The stock has been oscillating around its 21-day exponential moving average (EMA). It’s trading between its 50-day and 200-day simple moving averages (SMAs), the Relative Strength Index (RSI) has hovered around 50 for the past couple of weeks, and volume is light. So the price could go either way.
If LSCC breaks higher with strong follow-through, I’d consider adding a long position. If it breaks lower, I might look at a bearish options strategy, such as a short call spread or long put spread. That would mean digging into the options chain, which is available to StockCharts members. In SharpCharts, simply click the Options tab below the chart.
Which options strategy makes the most sense for Lattice Semiconductor? If you’re an OptionsPlay Add-On subscriber, the OptionsPlay Explorer tool can help you identify a strategy that fits your outlook and risk profile. Modify the recommended strategies until you come up with something that you’re comfortable with.
And One More Thing…
Tom Bowley, Chief Market Strategist at EarningsBeats.com will be hosting a free live session covering four things to watch as we head into September, a seasonally challenging time of the year for stocks.
What: Four Warning Signs, One Verdict When: Saturday, August 22, 10 AM ET
Gold and gold miners are showing renewed technical strength after months of weakness. Dave Keller, CMT, breaks down the emerging accumulation phase in GLD and GDX, then highlights the key breakout and resistance levels to watch for Agnico Eagle Mines. ...
Does the bull market in commodities still have room to run? Martin Pring conducts an in-depth technical analysis of commodity indexes and commodity-sensitive currencies and shares his findings. ...
With the S&P 500 reaching new highs, should investors be concerned about the possibility of a top forming? Tom Bowley breaks down the monthly, weekly, and daily charts of the S&P 500. Find out if technical signals are pointing to more upside or downside. ...
Technology stocks are breaking out with improving breadth. Arthur Hill explores charts of technology ETFs, which are showing clear signs of breakouts that have potential to resume the bigger uptrend. ...
Before We Dive In…
StockCharts’ Screener is built for convenience and speed. Simple and straightforward. You’ve got a thesis. You stack indicators. Layers upon layers. You plug it in, results come in fast. You’re in discovery mode.
But something’s missing. The presets don’t seem to match ...
The Financials sector has been up for 11 straight weeks. Will autumn volatility reverse the trend? Find out in this in-depth analysis of the sector. ...
As a StockCharts Member, you unlock all of our most powerful tools and features, including saved charts and settings, custom scans, technical alerts and much more. Discover all that StockCharts can do with our
free 1-month trial and start charting like a true market pro.