It was a rough week to get a read on the stock market. One day, the major equity indexes were down; the next day, they erased those losses and pushed higher; and finally, they finished the week not far from where they started.
Meanwhile, the bond market continues to command attention, and the timing couldn’t be more important. With inflation data coming next week ahead of the September 16 FOMC meeting, investors will be looking for clues about whether the Fed is likely to raise interest rates or leave them unchanged.
It was all about bonds
U.S. Treasury yields remain relatively high, and bond prices have paid the price. Remember, bond prices and yields move in opposite directions.
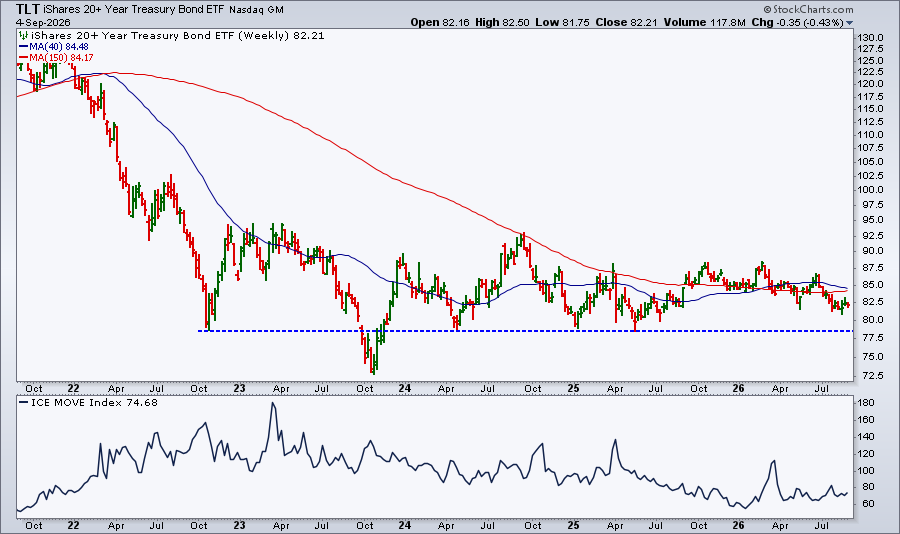
On the weekly chart of the iShares 20+ Year Treasury Bond ETF (TLT), price is approaching the 78.50 area, an important support level.
The ICE MOVE Index ($MOVE), which tracks volatility in the bond market, isn’t showing signs of rising stress. Notice how the MOVE Index spiked in March 2023, well ahead of the October low in bond prices.
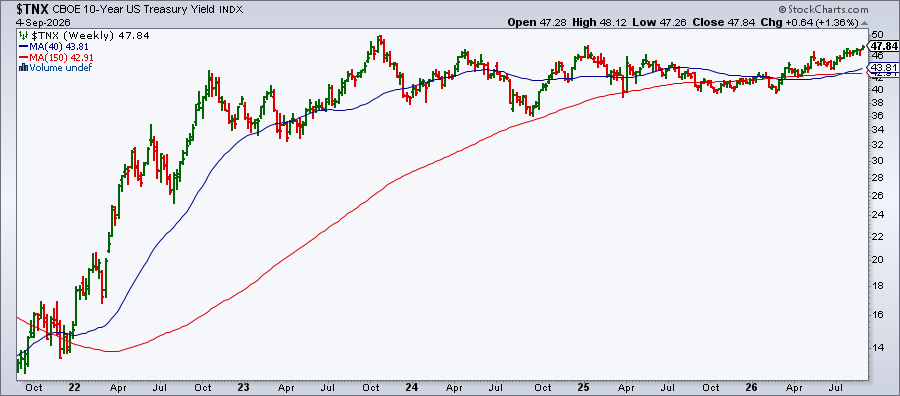
TLT fell below the 78.50 level in October 2023, which is when the 10-year Treasury yield reached its highest level in the last five years. We’re not too far from the 4.90% level, as you can see from the chart of the 10-Year US Treasury Yield Index ($TNX).
What’s especially interesting is that yields haven’t moved meaningfully lower since October 2023. Instead, they’ve been trading within an increasingly narrow range.
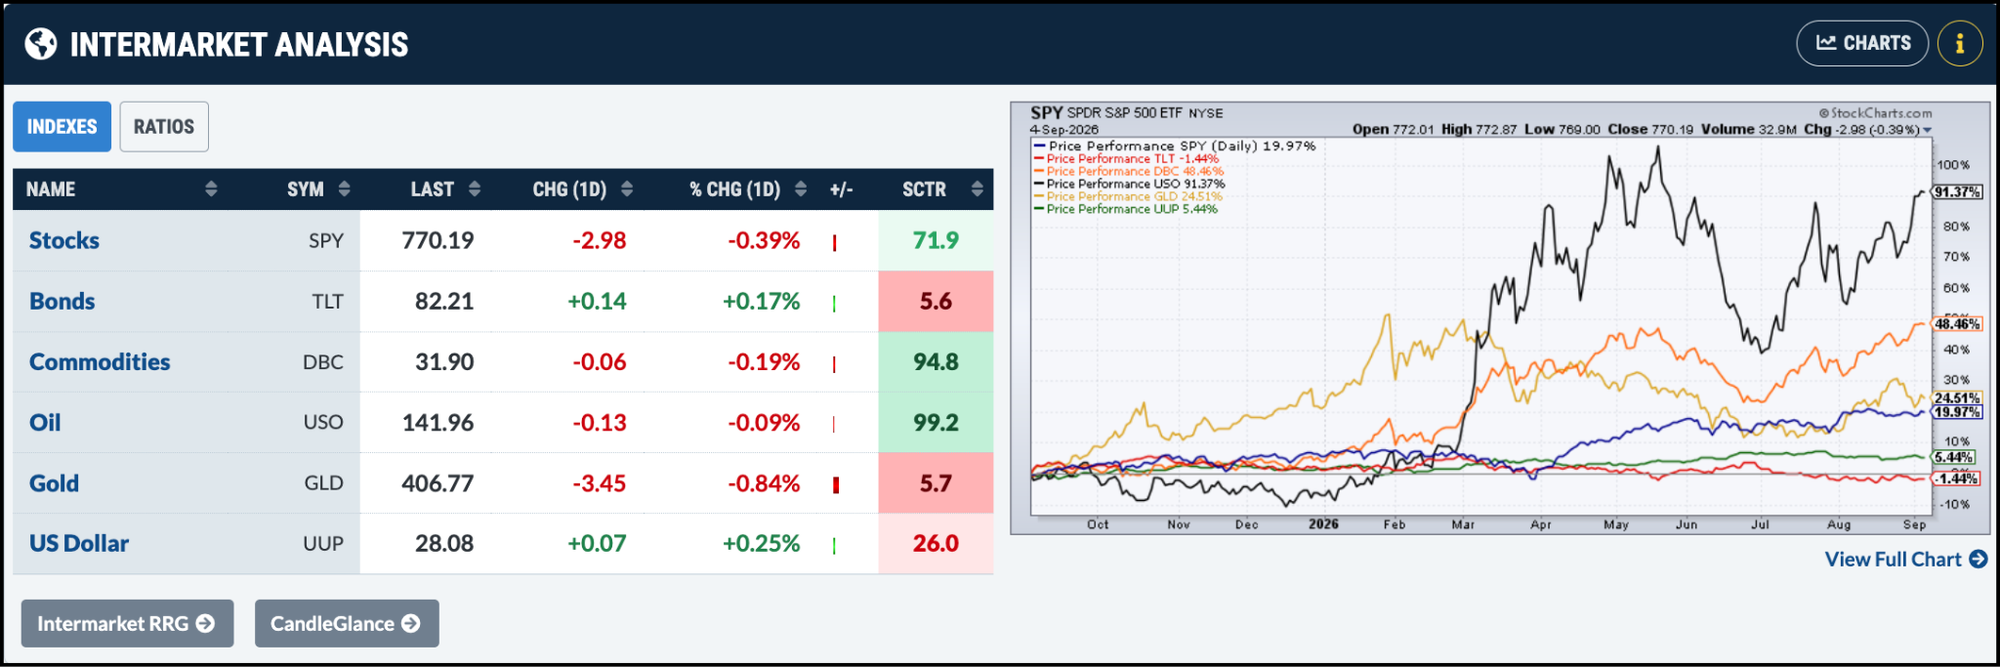
What happens in the bond market rarely stays in the bond market, and the ripple effects can spread across other asset classes. So far, equities have held up well even as the 10- and 30-year Treasury yields approach their highs. The Intermarket Analysis panel on the Market Summary page shows that equities have outperformed other major asset classes over the past year. But that’s no reason to get complacent.
The next week and a half could be especially important for investors. This is a good time to keep the Market Summary page close at hand and add TLT and $TNX to your ChartLists. Just click on the chart images and save them to a ChartList so you can monitor them alongside the broader market.
Next week’s inflation data should give us a little more clarity on the Fed’s next move and perhaps a better sense of what Mr. Market has in store.
The Nasdaq 100 has lost its leadership role as other areas of the market push higher. Dave Keller, CMT, outlines four possible QQQ scenarios into mid-October, from a return to all-time highs to a major risk-off decline, and identifies the signals that could confirm each path. ...
Chasing a rally and holding on to a losing stock for too long are two major trading mistakes. How do you avoid making these mistakes? Tom Bowley shows you how to recognize a good setup using two stocks as examples. ...
The VanEck Semiconductor ETF fell hard in July and has formed a corrective pattern. How can you take advantage of a bullish setup in SMH? Try using these two indicators to help identify the end of the corrective pattern. ...
Double-Cycle momentum reversals are rare, but bearish signals serve as reliable warning signals ahead of time. Are we seeing the warning sign now? Martin Pring sheds light by analyzing the chart of the S&P 500. ...
Crude oil is breaking out and, with September being a seasonally strong month for the commodity, equities could feel some pressure. With bond prices falling and the U.S. dollar rising, investors should be prepared to take a defensive position. ...
Technology takes the lead this week, while Industrials show weakness. Julius de Kempenaer analyzes stock market sector performance using RRG charts. ...
As a StockCharts Member, you unlock all of our most powerful tools and features, including saved charts and settings, custom scans, technical alerts and much more. Discover all that StockCharts can do with our
free 1-month trial and start charting like a true market pro.