September is seasonally one of the weaker months for stocks, and so far, it’s giving investors plenty to chew on.
Interest rates
Crude oil prices
Learn to trade credit spreads
Yields are up
The much-awaited August inflation report is finally behind us, and the numbers helped calm the market after Thursday’s selloff.
The good news: Inflation came in line with expectations.
The not-so-good news: Inflation is still in the picture, and the Fed is expected to raise interest rates on Wednesday.
According to the CME FedWatch Tool, the odds of a rate hike were at 86.50% on Friday. In some ways, it feels as though the market is one step ahead of the Fed. Treasury yields remain elevated, which isn’t surprising given the recent rise in oil and diesel prices. And this brings us to the main focus of the market...
Oil prices are rising
Crude oil pulled back on Friday, but prices remain elevated. The chart of West Texas Crude Oil ($WTIC) below shows a clear uptrend, with price trading well above the 21-day exponential moving average (EMA).
I’ve marked several key support and resistance levels based on previous highs and lows using the Annotation tool. These horizontal lines make it much easier to see where oil could run into resistance or where the trend could weaken.
💡
How to draw horizontal lines. Click the Annotate button > select the Line tool > Trendline. Anchor your cursor at the starting point, press and hold the Command key on a Mac or the Windows key on PC > click and drag the mouse horizontally to your ending point.
If geopolitical tensions escalate, there’s still plenty of room for oil prices to move higher. The next level I’m watching is the $106 level, which lines up with the May 2026 high. A move above that could put the April highs back in play.
The opposite scenario is just as likely. If tensions ease and oil falls below $93.50, it could quickly pull back to its 21-day EMA. If this were to happen, there could be a noticeable shift in the market narrative. Lower oil prices could pull U.S. Treasury yields down, which could provide some relief for equities.
StockCharts members can view the Intermarket Analysis panel in the Market Summary page to get a bird's-eye view of how stocks, bonds, oil, and precious metals are performing relative to one another.
These markets don’t move in isolation, and monitoring them can provide some clues as we head into next week’s FOMC meeting. The chart below puts this in perspective. Over the last year, oil is up 112.19% while bonds are down 6.38%.
The question is whether the relationships between these asset classes changes, especially with the Fed meeting and the midterm elections getting closer.
Trading in uncertain times
When the market doesn’t have a clear directional trend, options can provide another way to approach the market.
Tony Zhang, Chief Strategist at OptionsPlay, is hosting a live event where he’ll walk through how to find and set up credit spreads. One of the advantages of these strategies is that your potential profit and maximum risk are defined before you enter the trade.
What: Find the Best Credit Spreads in Under 60 Seconds
When: Tuesday, September 15, 2026, at 12:00 PM ET.
The S&P 500 is close to its highs, but market breadth may be sending warning signals. Mary Ellen McGonagle analyzes the equal-weighted S&P 500 and the Nasdaq 100 Bullish Percent Index for signs of a potential rebound or warning. ...
The Hindenburg Omen has been firing repeatedly in 2026, creating a rare cluster of potential market top signals. Dave Keller, CMT, reviews similar periods in market history and explains why a confirmed break of S&P 500 support could validate this bearish warning. ...
SPY remains in a long-term uptrend, led by strong leadership. Arthur Hill analyzes SPY's breadth to determine whether the ETF has a bullish or bearish bias. ...
Before We Dive In…
You open your charts on a Monday morning, bad week behind you. And it turns out this one’s worse. Positions are under pressure, with one reversing badly. So you check the indicators. Trend says one thing; momentum says another. Volume’s no help this time. ...
Signs of September weakness in the stock market have surfaced. Retail, transports, and other cyclical and defensive asset classes are displaying warning signs. Here are the charts you need to watch closely. ...
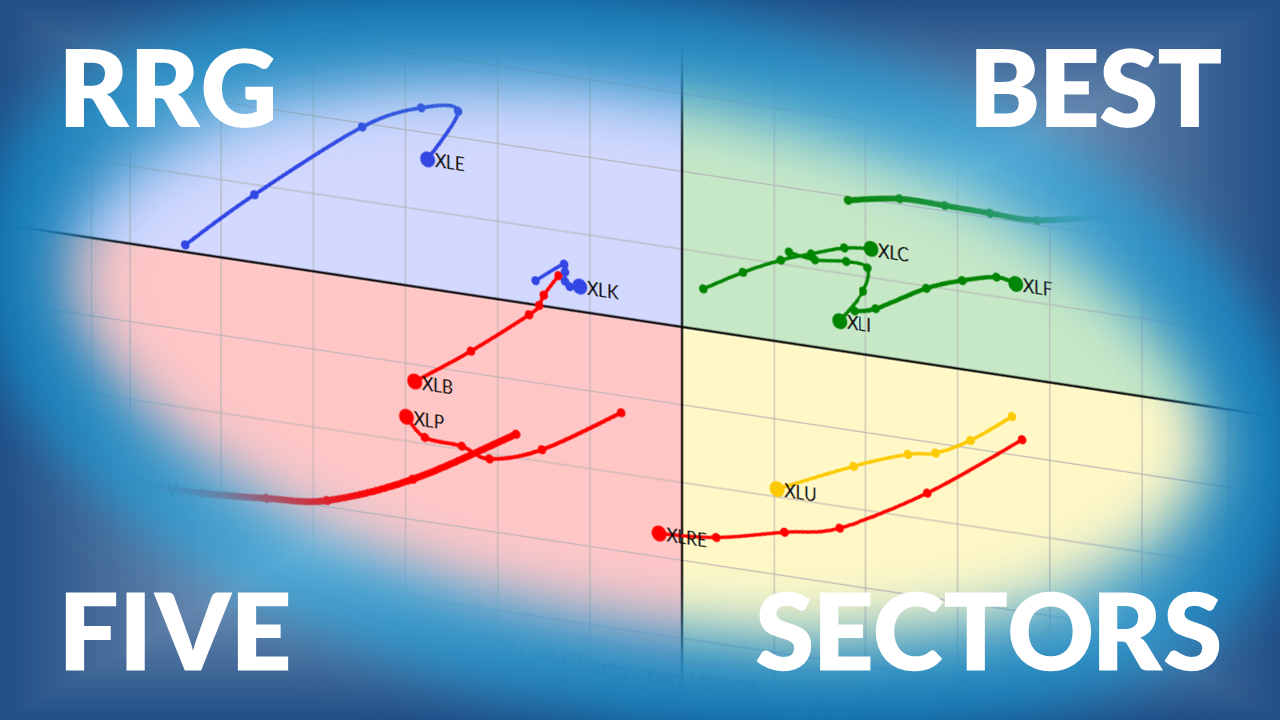
Julius de Kempenaer presents his weekly update on US sector rotation, using relative rotation graphs. The S&P 500's 0.23% gain was driven primarily by Energy, Technology, and Utilities. ...
September is generally a seasonally weak period for equities, but there are pockets of strength. These StockCharts tools will help you monitor the market's action and set up your investment game plan for the rest of the month and/or year. ...
As a StockCharts Member, you unlock all of our most powerful tools and features, including saved charts and settings, custom scans, technical alerts and much more. Discover all that StockCharts can do with our
free 1-month trial and start charting like a true market pro.