The stock market bounced around this week but managed to recover from Wednesday’s selloff. By Friday’s close, the S&P 500 ($SPX) and Nasdaq Composite ($COMPQ) had fought their way back into positive territory, with most of it coming in the final hour of trading.
But the biggest gains weren’t in stocks. They were in cryptocurrencies. With Bitcoin back above $80,000 and several major cryptocurrencies breaking out, does it mean that “risk-on” is still in vogue?
This week’s update:
Treasury yields are still rising
Cryptocurrencies are flashing bullish signals
How to find stocks with breakout potential
Treasury yields jump
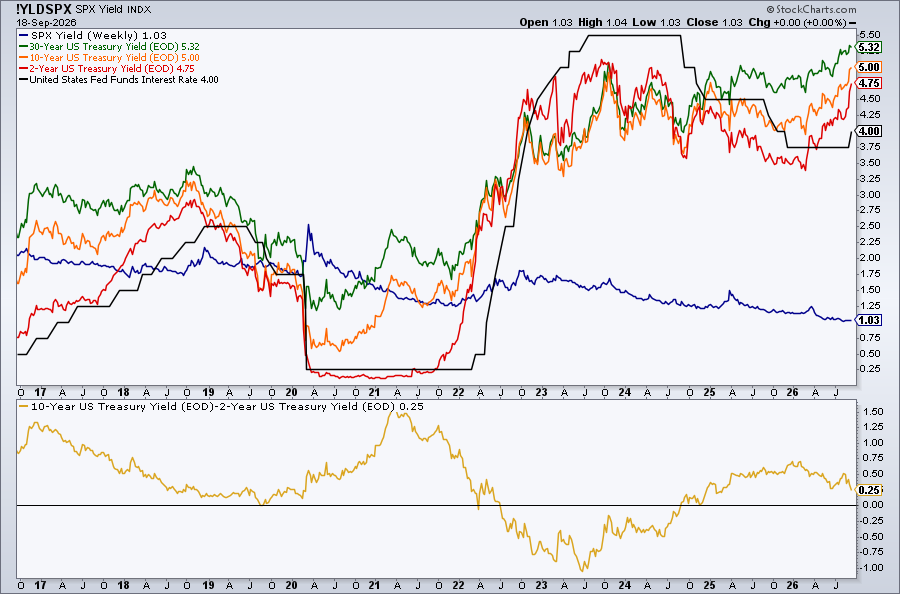
Treasury yields rose on Friday, with the 10-Year Treasury Yield Index ($TNX) closing at 4.998%. The chart below, available to StockCharts members through the Market Summary ChartPack, puts the yield move into perspective. The 30-, 10-, and 2-year Treasury yields are well above the Federal Funds Rate, which was raised to 3.75–4% on Wednesday.
The bottom panel shows the spread between the 10-year and 2-year yields, which is now approaching the zero line.
Crypto’s bullish move
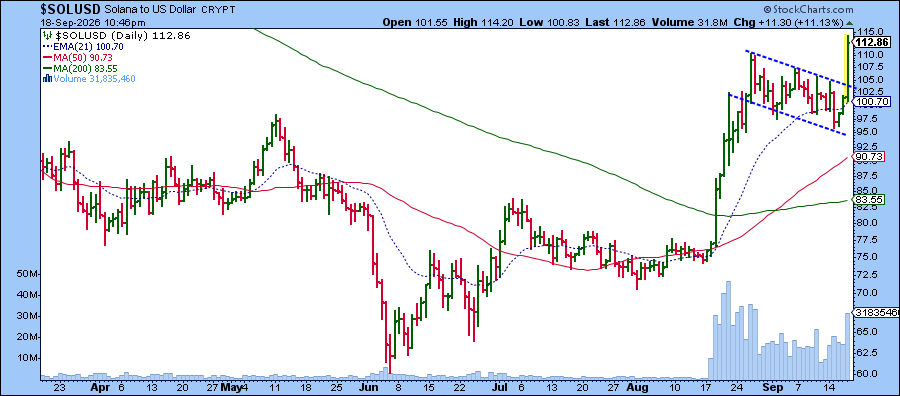
Cryptocurrencies didn’t seem to be bothered by the Clarity Act failing to pass. On Friday, Bitcoin ($BTCUSD) jumped 6.18% and closed above $80,000. Ethereum ($ETHUSD) and Solana ($SOLUSD) posted even larger gains. Several cryptocurrencies are breaking out of continuation patterns, giving the asset group a much more bullish technical look. Take a look at the chart of Solana below.
When you see such breakouts, you might wonder if similar setups are developing elsewhere. Well, there are stocks that are breaking out of continuation patterns, and you’ll find some of them in this week’s article lineup below.
You can also search for these breakouts with the StockCharts scanning tools by creating a scan or browsing the Sample Scan Library, particularly the Technicals and Chart Patterns sections.
There’s another way to sharpen your process for finding stocks with breakout potential, sometimes before they gain the financial media’s attention.
Learn how to find winning stocks
Finding promising stocks is one part of becoming a successful trader or investor. Building a repeatable process for finding them and knowing when a setup is no longer working is just as important.
StockCharts is now offering a course from Mary Ellen McGonagle, which you can find in the StockCharts Marketplace. In the course, you’ll learn to:
Build a repeatable process for finding stocks with potential. Learn to recognize price patterns that can signal a stock that’s preparing to break out.
Read the broader market. Know when institutional investors may be moving away from high-flying stocks.
Protect your capital. Understand when the bullish case is no longer valid and when it might be time to move on.
Successful investing isn’t just about finding great stocks or ETFs. It’s also recognizing when to fold your positions.
History sides with the bulls when the Fed starts hiking interest rates. Tom Bowley looks at past interest rate hikes and analyzes the S&P 500's price action. ...
Investors need to not only find strong stocks but also know when the risk/reward equation has changed. Mary Ellen McGonagle discusses why this is an important part of the investing equation. ...
The Mag 7 ETF is making waves as it breaks out of a bullish continuation pattern, with follow-through at the breakout and positive relative strength vs. the SPY. Arthur Hills analyzes and breaks down the chart. ...
As we head into a bearish seasonal stretch, the Mag 7 stocks are showing signs of strength. With strong relative strength and healthy-looking technical indicators, this group could lead the broader stock market higher. ...
Stocks often weaken before the economy shows signs of stress. Martin Pring evaluates the stocks/commodities and stocks/bonds intermarket relationships and shows how they can be used to identify turning points. ...
Before We Dive In…
In the last article, we covered the Trend part of the DecisionPoint Market Scoreboard. The scoreboard has four segments, and they’re meant to be read together. But each segment is already technically rigorous. If you’re new to it, you might find yourself confused.
So, ...
As a StockCharts Member, you unlock all of our most powerful tools and features, including saved charts and settings, custom scans, technical alerts and much more. Discover all that StockCharts can do with our
free 1-month trial and start charting like a true market pro.