The weaker-than-expected jobs report eased concerns of an interest rate hike in the next FOMC meeting. Growth stocks reacted positively to the news. At one point, the Nasdaq Composite ($COMPQ) hit a new high but pulled back while the Nasdaq 100 ($NDX) notched a record close. So, overall, it looks like the stock market wants to move higher, but the leadership is concentrated.
This week’s update:
Treasury yields pull back
Technology continues to lead
Sharper charts and more
Treasury yields ease
A softer inflation report and weaker-than-expected jobs report gave the bond market a boost. It also lowered expectations for an interest rate hike at the next Federal Reserve meeting. Treasury yields came off their highs, but ended up closing higher. The change in rate expectations is beginning to show up in interest rate-sensitive areas of the market. Banks, homebuilders, and real estate are starting to show upside movement, but it's still early.
The next few weeks should give us a better idea of whether yields have peaked. For now, though, technology stocks are in the driver’s seat.
Mag 7 push higher
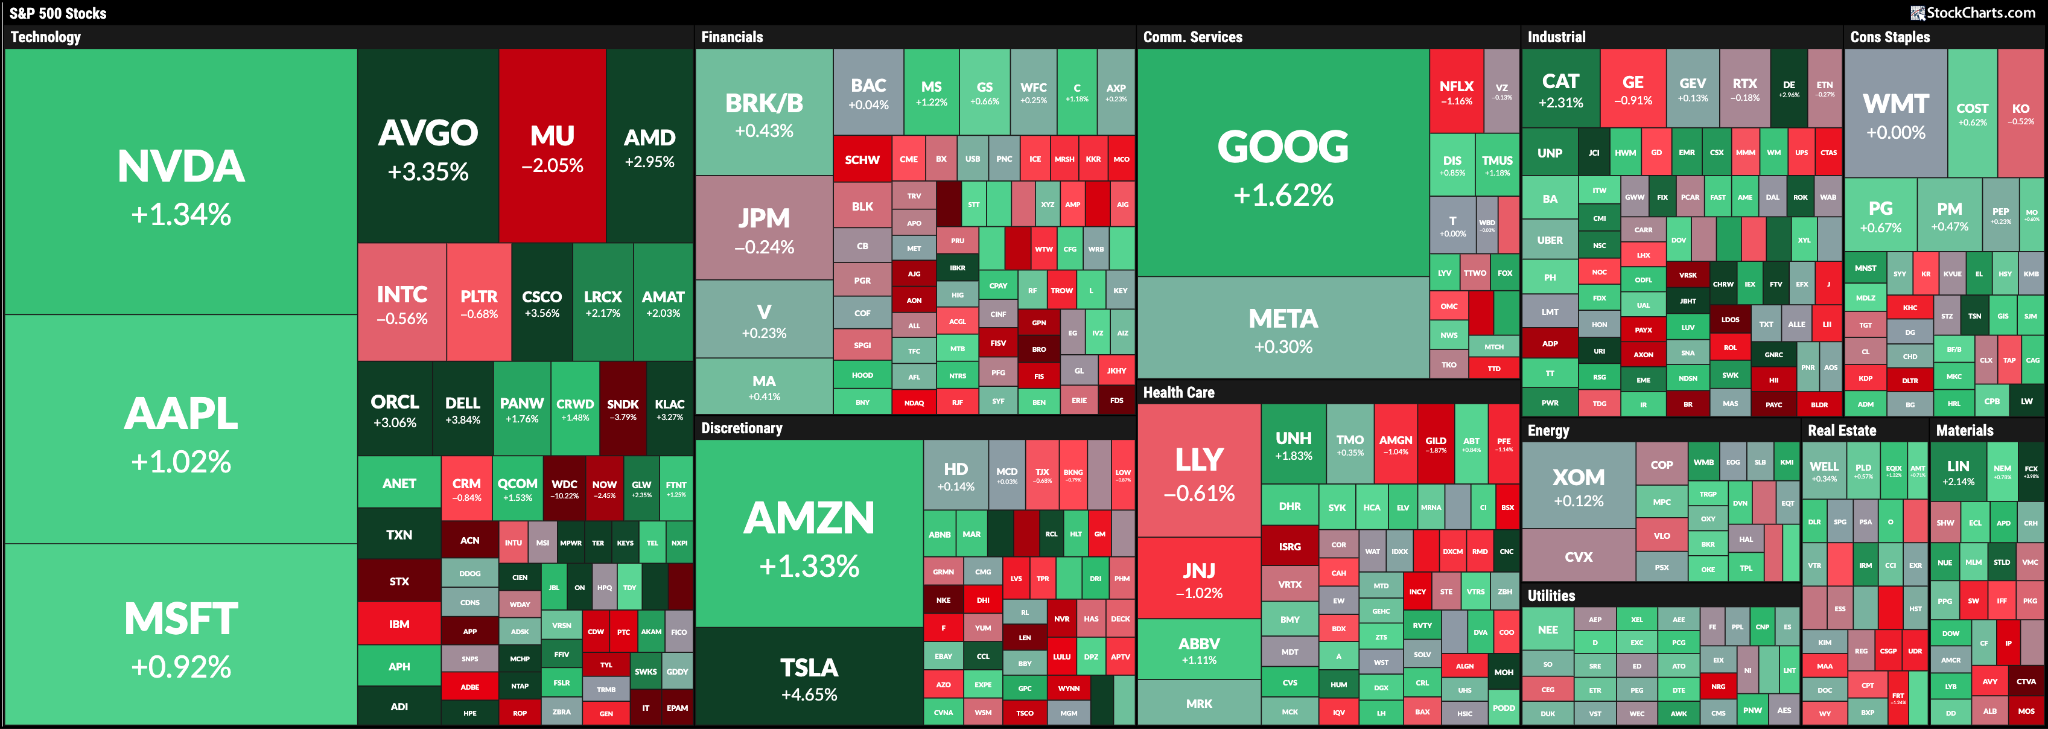
The Magnificent Seven stocks posted strong gains on Friday. A quick look at the MarketCarpet shows big moves from NVIDIA (NVDA), Apple (AAPL), Microsoft (MSFT), Amazon (AMZN), Alphabet (GOOGL), and Tesla (TSLA). Meta (META) also finished higher but with the smallest gain of the group.
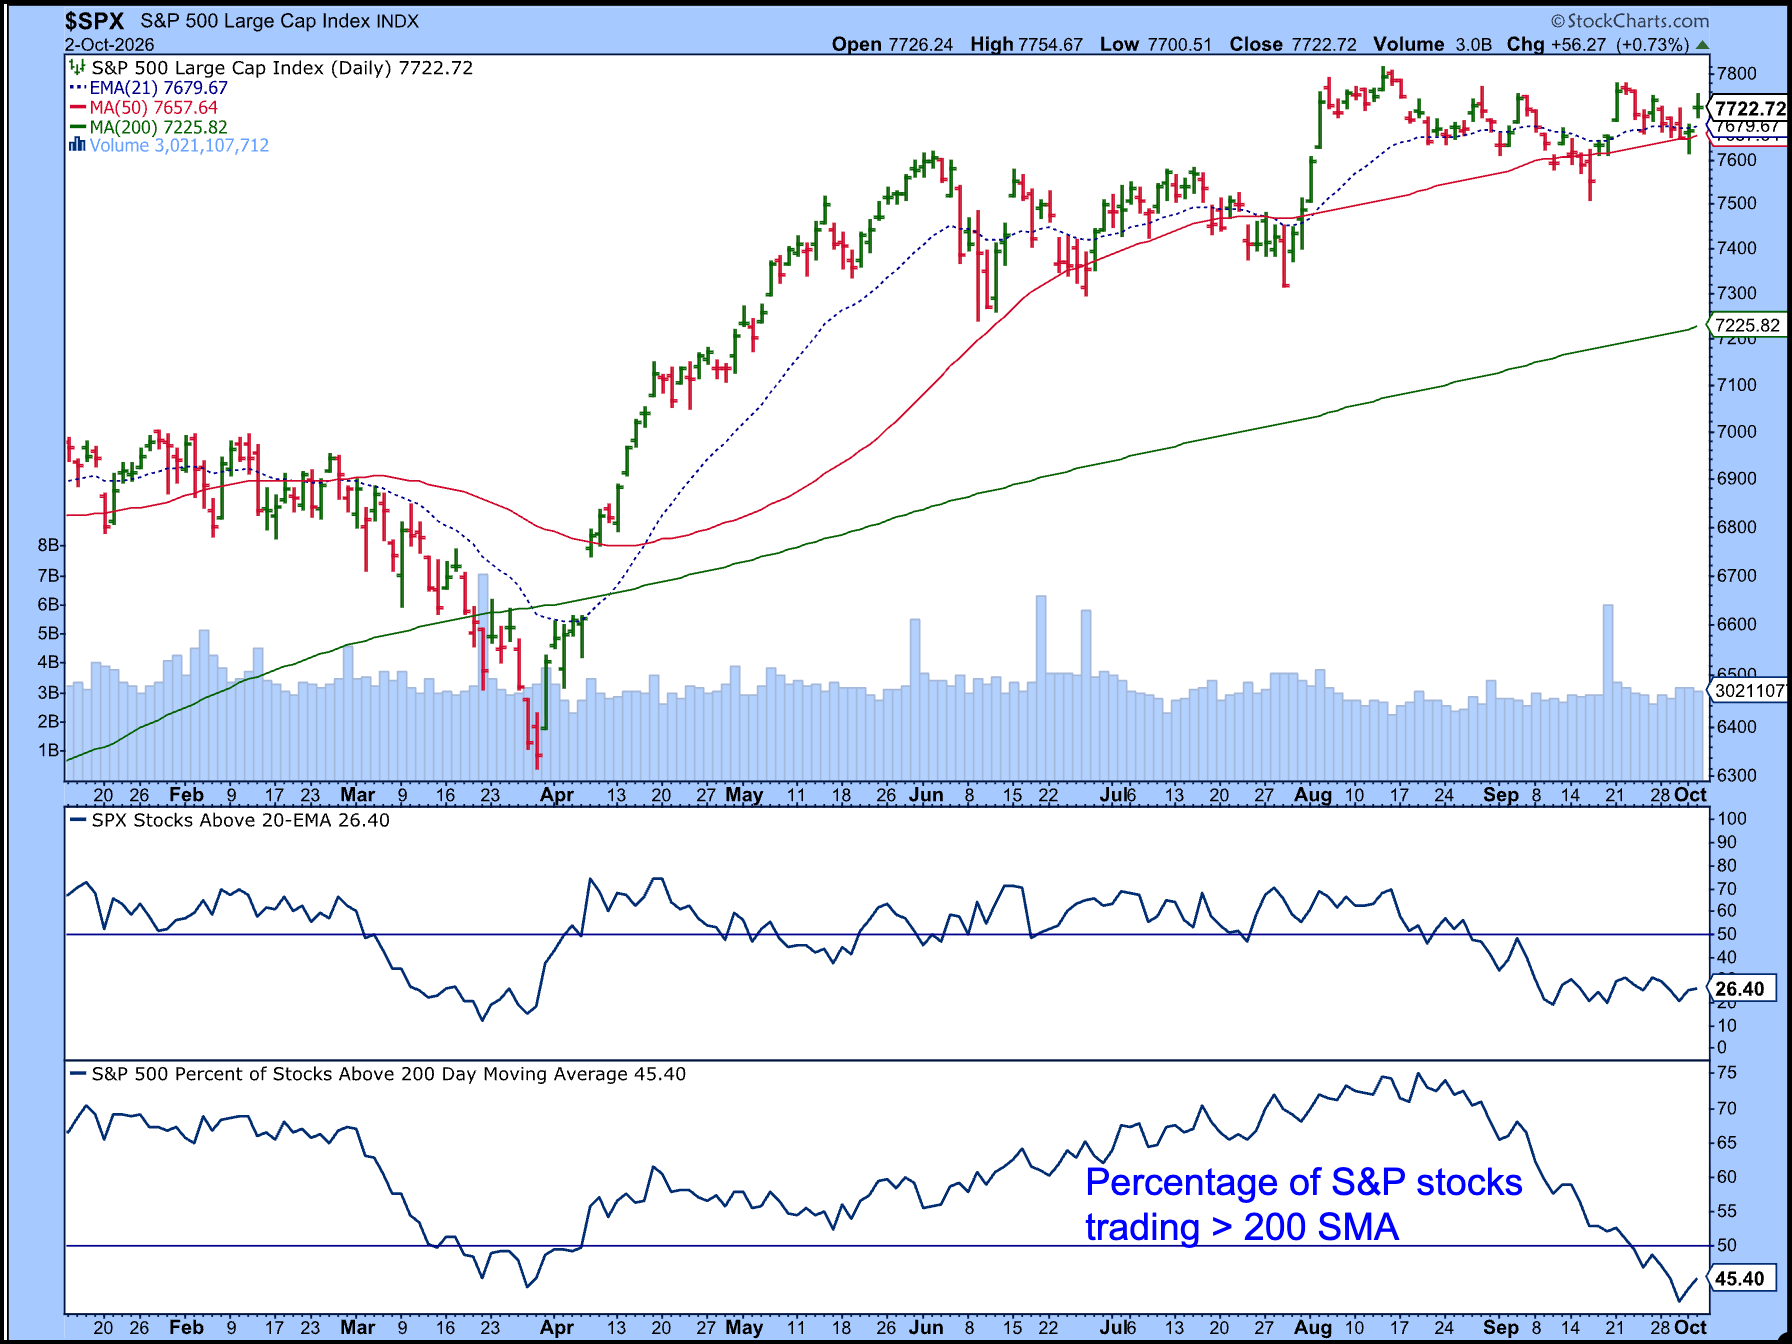
The strength is helping to move the major indexes higher, but the broader market isn’t keeping up the same pace. Look at the percentage of S&P 500 stocks trading above their 200-day moving average. It’s at 45.40%, which tells us that fewer than half of the S&P 500 stocks are participating in the uptrend.
SharpCharts just got sharper
Last week, we gave SharpCharts a facelift, and sometimes a small change can make a big difference. They're the same charts, but they look sharper. The lines are cleaner, annotations are crisper, and the charting experience feels more polished. So, switch on the high-def chart settings and take these charts for a spin.
This is just one of the improvements we’ve been working on to improve your chart experience.
If you're not currently a StockCharts member or you’ve been thinking of reactivating your subscription, now is a great time to join. For a limited time, we're offering two free months of StockCharts. The offer ends on October 11, 2026.
The 10-year U.S. Treasury yield has climbed above 5%. See how higher rates are affecting stocks, driving sector rotation, and shaping the market outlook. ...
Not all mega cap growth stocks are showing the same technical picture. Dave Keller, CMT, explains how bucketing charts into good, OK, and bad categories can focus your attention, using NVIDIA, Alphabet, and Broadcom to illustrate bullish, neutral, and bearish setups. ...
Have bonds put in a primary trend bottom? Martin Pring analyzes charts of TLT, Treasury yields, and corporate bonds and discusses why he believes bond prices have bottomed. ...
Before We Dive In…
Gold, silver, and Bitcoin are three entirely different assets. Gold’s a monetary metal. Silver’s a hybrid of monetary and industrial. Bitcoin’s a volatile crypto that somehow earned its street cred as digital gold. Yet they've lumped together under the “safe-haven” ...
Small caps pulled back from August highs, but October's bullish midterm seasonality could signal a reversal. Explore what's next for IWM and other small-cap stocks and ETFs. ...
The S&P 500 has gone nowhere since early August, and the RSI confirms the lack of directional momentum. Dave Keller, CMT, explains how RSI range rules can identify bullish, bearish, and sideways trends, and why a break of price and momentum support could signal trouble into Q4. ...
As a StockCharts Member, you unlock all of our most powerful tools and features, including saved charts and settings, custom scans, technical alerts and much more. Discover all that StockCharts can do with our
free 1-month trial and start charting like a true market pro.
The "Symbol Summary" panel within StockChartsACP adds a powerful research tool to your charts, including a full quote summary for stocks, ETFs, mutual funds and indexes with technical stats, fundamentals, earnings, after-hours data, dividends, corporate info and more.