What timing! Wall Street served up a spooktacular stock market just in time for Halloween. The Nasdaq Composite ($COMPQ) took the biggest hit, falling more than 5% in October. The S&P 500 ($SPX) and Dow Jones Industrial Average ($INDU) held up considerably better. The S&P 500 finished the month down 0.93% while the Dow managed to squeeze out a 1.70% gain.
This week’s update:
Tech stocks take a beating
More new StockCharts features
Finding the bright spots
Wall Street’s scarefest
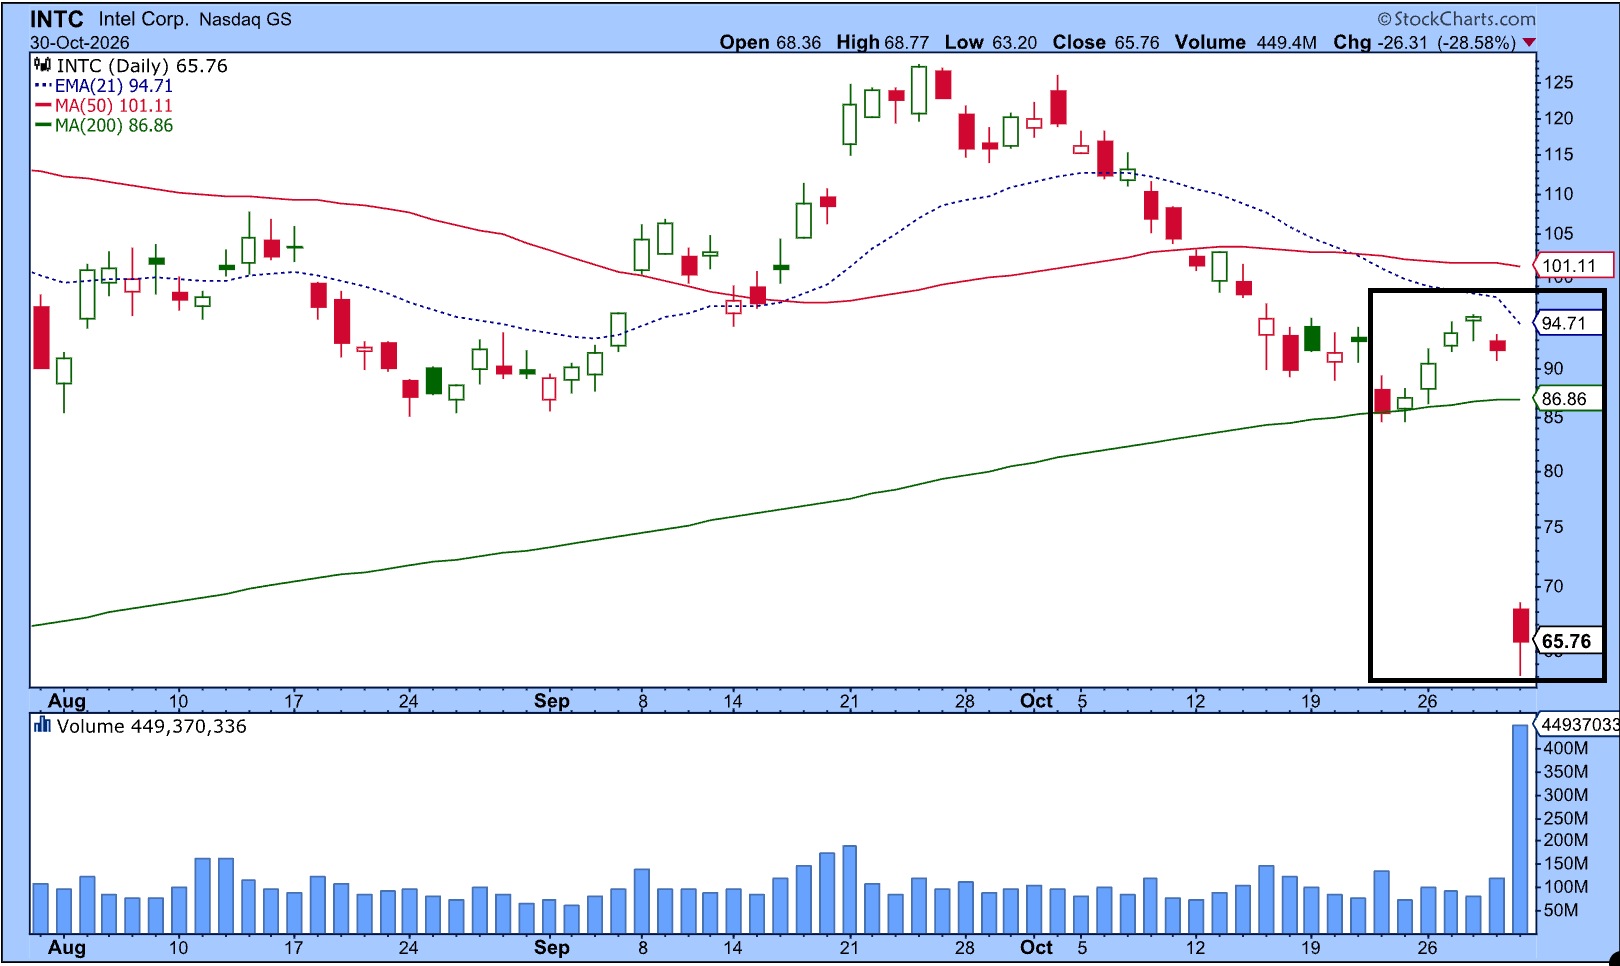
Friday’s horror story was Intel (INTC), which plunged more than 28%. That was the stock’s worst one-day drop in 50 years! One look at Intel’s chart is enough to send you running faster than a trick-or-treater who sees zombies at the front door.
And Intel wasn’t the only stock frightening investors. If you’re curious about what other stocks got slammed, head to the Market Movers panel of your StockCharts Dashboard and click the %Down button. Browse through the different indexes to see which stocks took the biggest hits.
Then switch to %Up. Recognize some of these symbols? Even though technology stocks may be struggling, there are stocks in other asset groups that are bucking the trend.
Onward and upward
Fortunately, market volatility doesn’t slow down our developers. They’re hard at work making StockCharts better, with new features and improvements to make your charting experience simpler.
We’ve recently introduced the Screener, AI Scan Wizard, and a beta version of ACP. We’ve also rolled out high-definition SharpCharts and given our Seasonality charts a fresh look.
There’s another improvement I want to bring to your attention. You may have spotted it already.
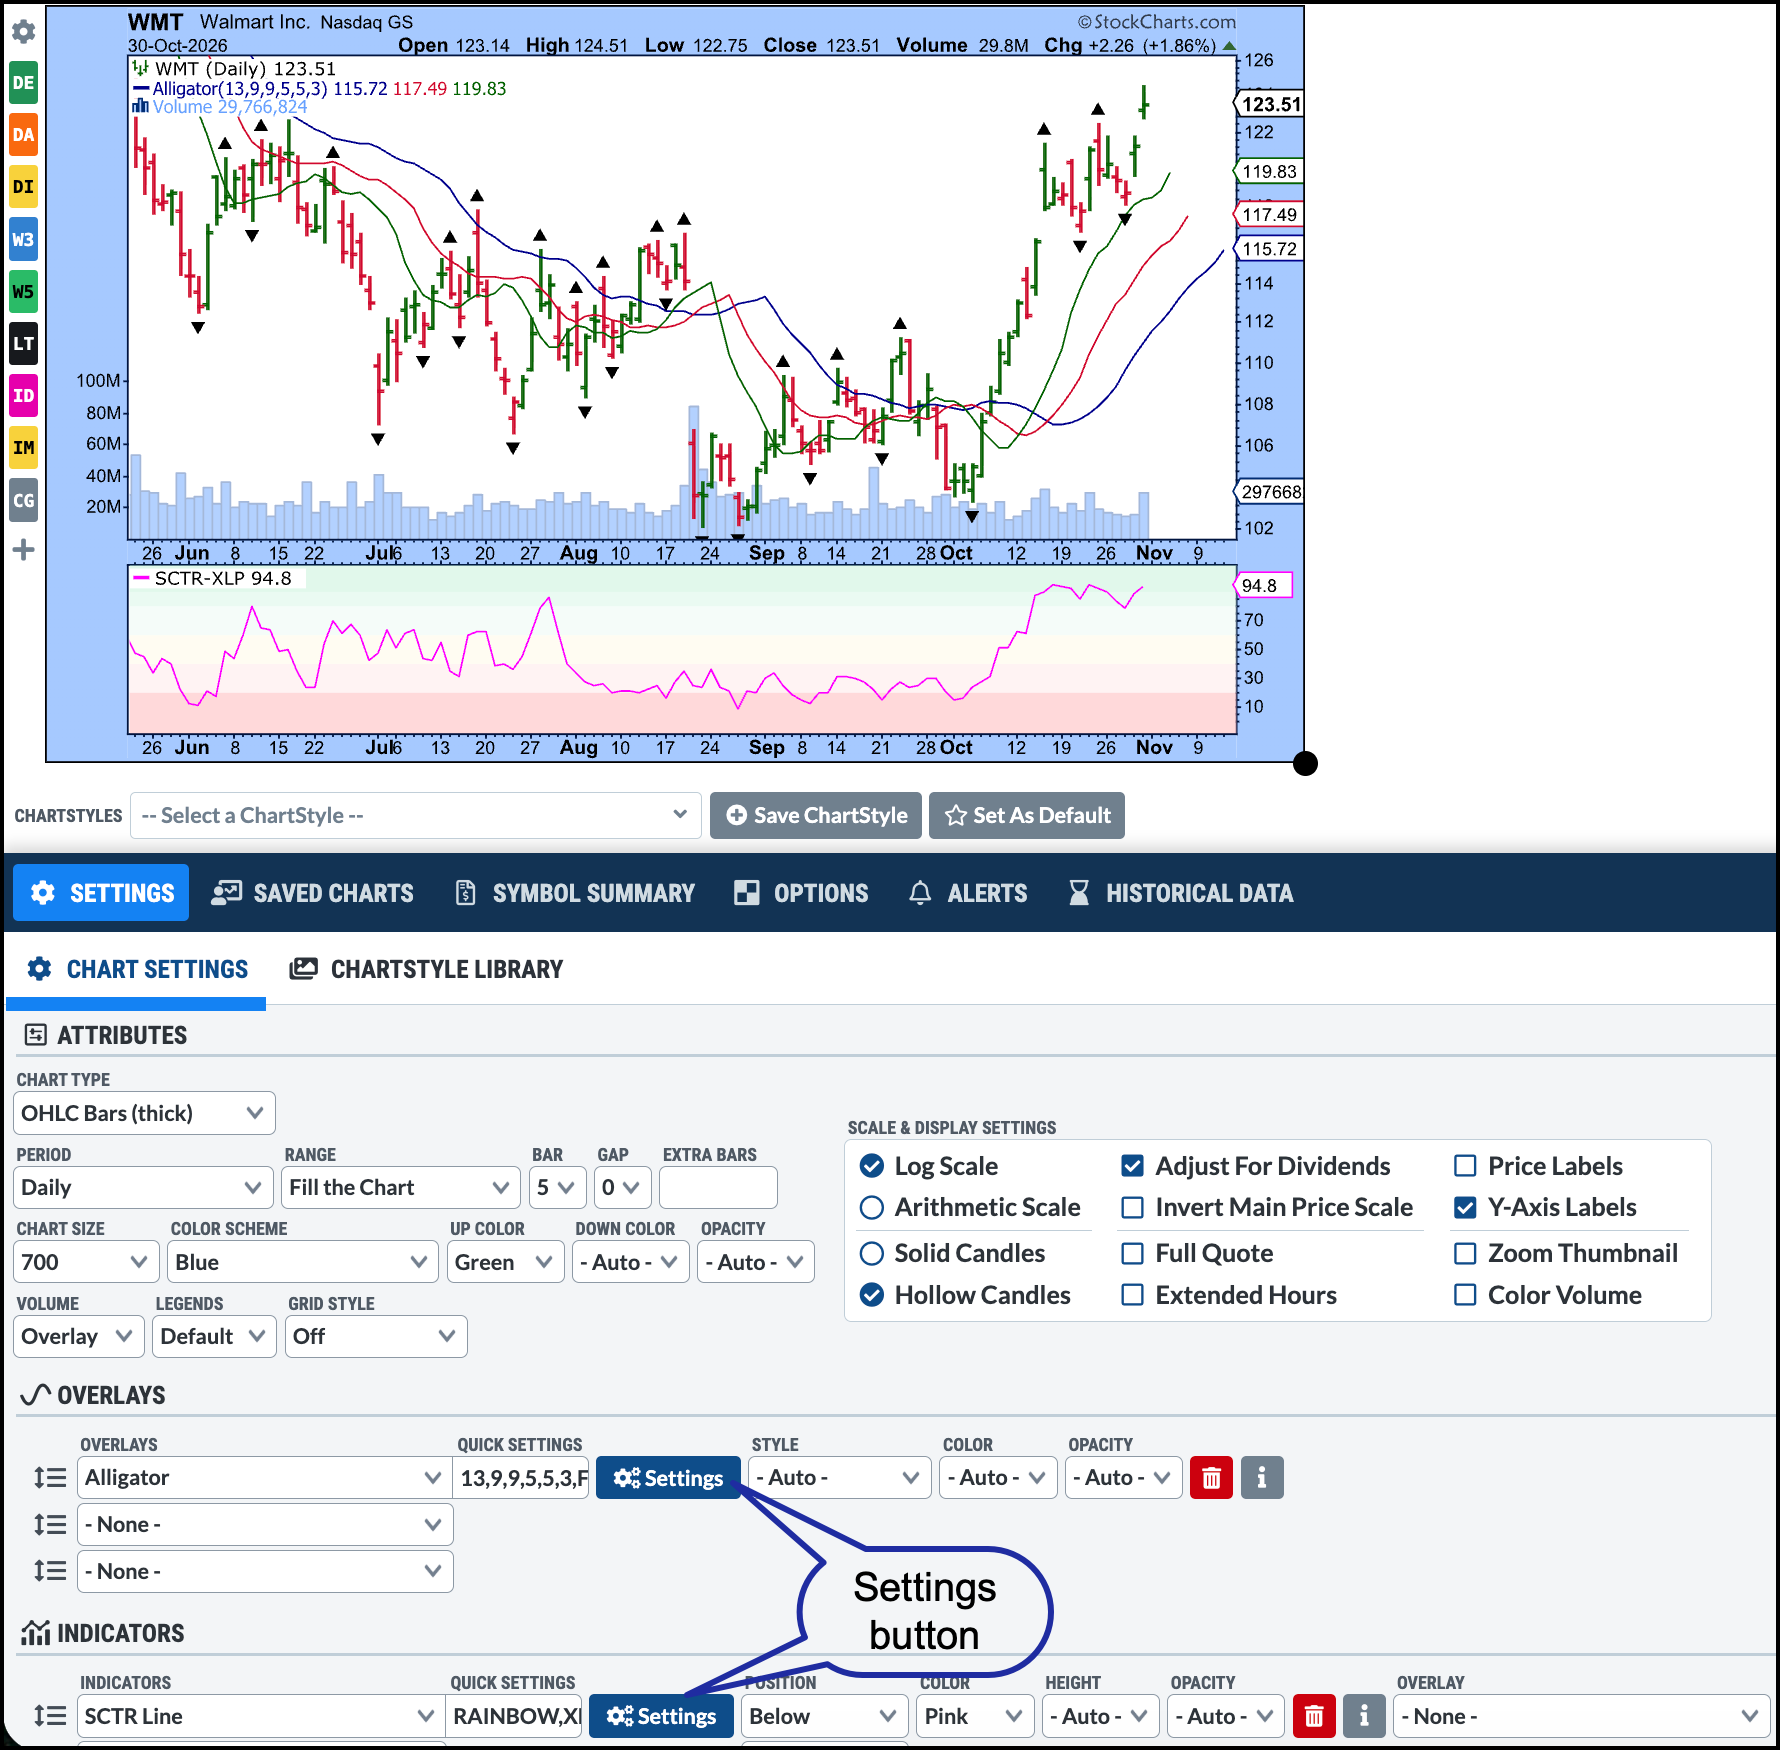
In the Overlays and Indicators sections of Chart Settings, we’ve added individual setting interfaces for indicators and overlays. Instead of working through a list of parameters, you can now click the blue Settings button, change your parameters, and apply them. It’s much more user-friendly.
Here’s an example.
In the chart of Walmart (WMT), I’ve added the Alligator Overlay and the StockCharts Technical Rank (SCTR) indicator. When I click the blue Settings button next to the Alligator quick settings, I can adjust the overlay parameters, style settings, and choose whether to display fractals.
For the SCTR Line, I entered XLP in the Compare Symbol box. That means the SCTR Line on my Walmart chart displays the SCTR for XLP rather than WMT. I also selected the Rainbow Background, which makes it easier to see when the indicator is showing strong, neutral, or weak technical conditions.
And don’t worry. If you prefer to use the previous style settings, they're still available. The new interface may look like a small change, but it makes it easier to fine-tune your indicators and experiment with different settings with minimal interruptions to your workflow.
Finding green shoots
With technology stocks taking a beating, it’s natural to focus on all the red signals. But there’s a brighter side.
Energy, Consumer Staples, and Health Care have been holding up relatively well. Walmart, one of the largest-weighted stocks in the Consumer Staples sector, is in a clear uptrend (see above chart).
This might be a good time to fire up the StockCharts scanning tools and look for stocks showing strength in the better-performing sectors. You may find some candidates worth saving to your ChartLists.
Or, dare I say it, you could turn your attention to beaten-down technology stocks and look for signs of a “buy the dip” opportunity.
Either way, there’s plenty to investigate.
Well, we’ve survived Wall Street’s Halloween fright fest. Now we’re ready for whatever scary costumes show up at our doors on Saturday night.
From a seasonality perspective, November is a bullish month, especially for the Financials sector. Tom Bowley breaks down his analysis using the StockCharts Seasonality Charts. ...
Is the market forming a major top or simply rotating away from mega cap technology? Dave Keller, CMT, examines S&P 500 support, improving market breadth, and contrasting technical setups in Meta, Alphabet, and Visa to identify where strength remains. ...
Some noteworthy rotations took place in the stock market in October. Health Care and Energy are the strongest sectors while Technology is the weakest. Arthur Hill analyzes the Biotech ETF IBB and shows a correction may be in the works. ...
Learn how to use StockCharts stock scans and the AI Scan Wizard to find strong stocks, spot sector rotation, and uncover trading opportunities in any market. ...
As crack spreads ease, Exxon Mobil and Chevon are two stocks that could benefit from this development. These bullish chart patterns and seasonality trends favor further upside moves in Chevron and Exxon Mobile stock prices. ...
Before We Dive In…
Candlestick charts have been around for centuries in Japan. But it wasn’t until 1989 that Steve Nison introduced them to the West. Since then, they’ve gone from obscure trading-desk jargon to viral social media content. But popular and profitable are two separate things. ...
As a StockCharts Member, you unlock all of our most powerful tools and features, including saved charts and settings, custom scans, technical alerts and much more. Discover all that StockCharts can do with our
free 1-month trial and start charting like a true market pro.