I can’t remember a week quite like this in the stock market since COVID. Wednesday’s euphoria gave way to Thursday’s brutal selloff, leaving investors plenty to chew on. Friday’s strong jobs report helped stop the bleeding, but it did little to restore investor confidence.
This week’s update:
Has the AI bubble burst?
Where to find strength in a weak market
Your money, your decisions
Has the AI bubble burst?
Thursday’s sell-off was painful, especially for hedge funds with heavy exposure to hyperscalers and other AI-related stocks. Some firms suffered massive losses, while others exited the equity business. Investors are now questioning whether the AI bubble is finally bursting.
Rather than getting caught up in the headlines, let’s put the emotions aside and see what the charts are telling us.
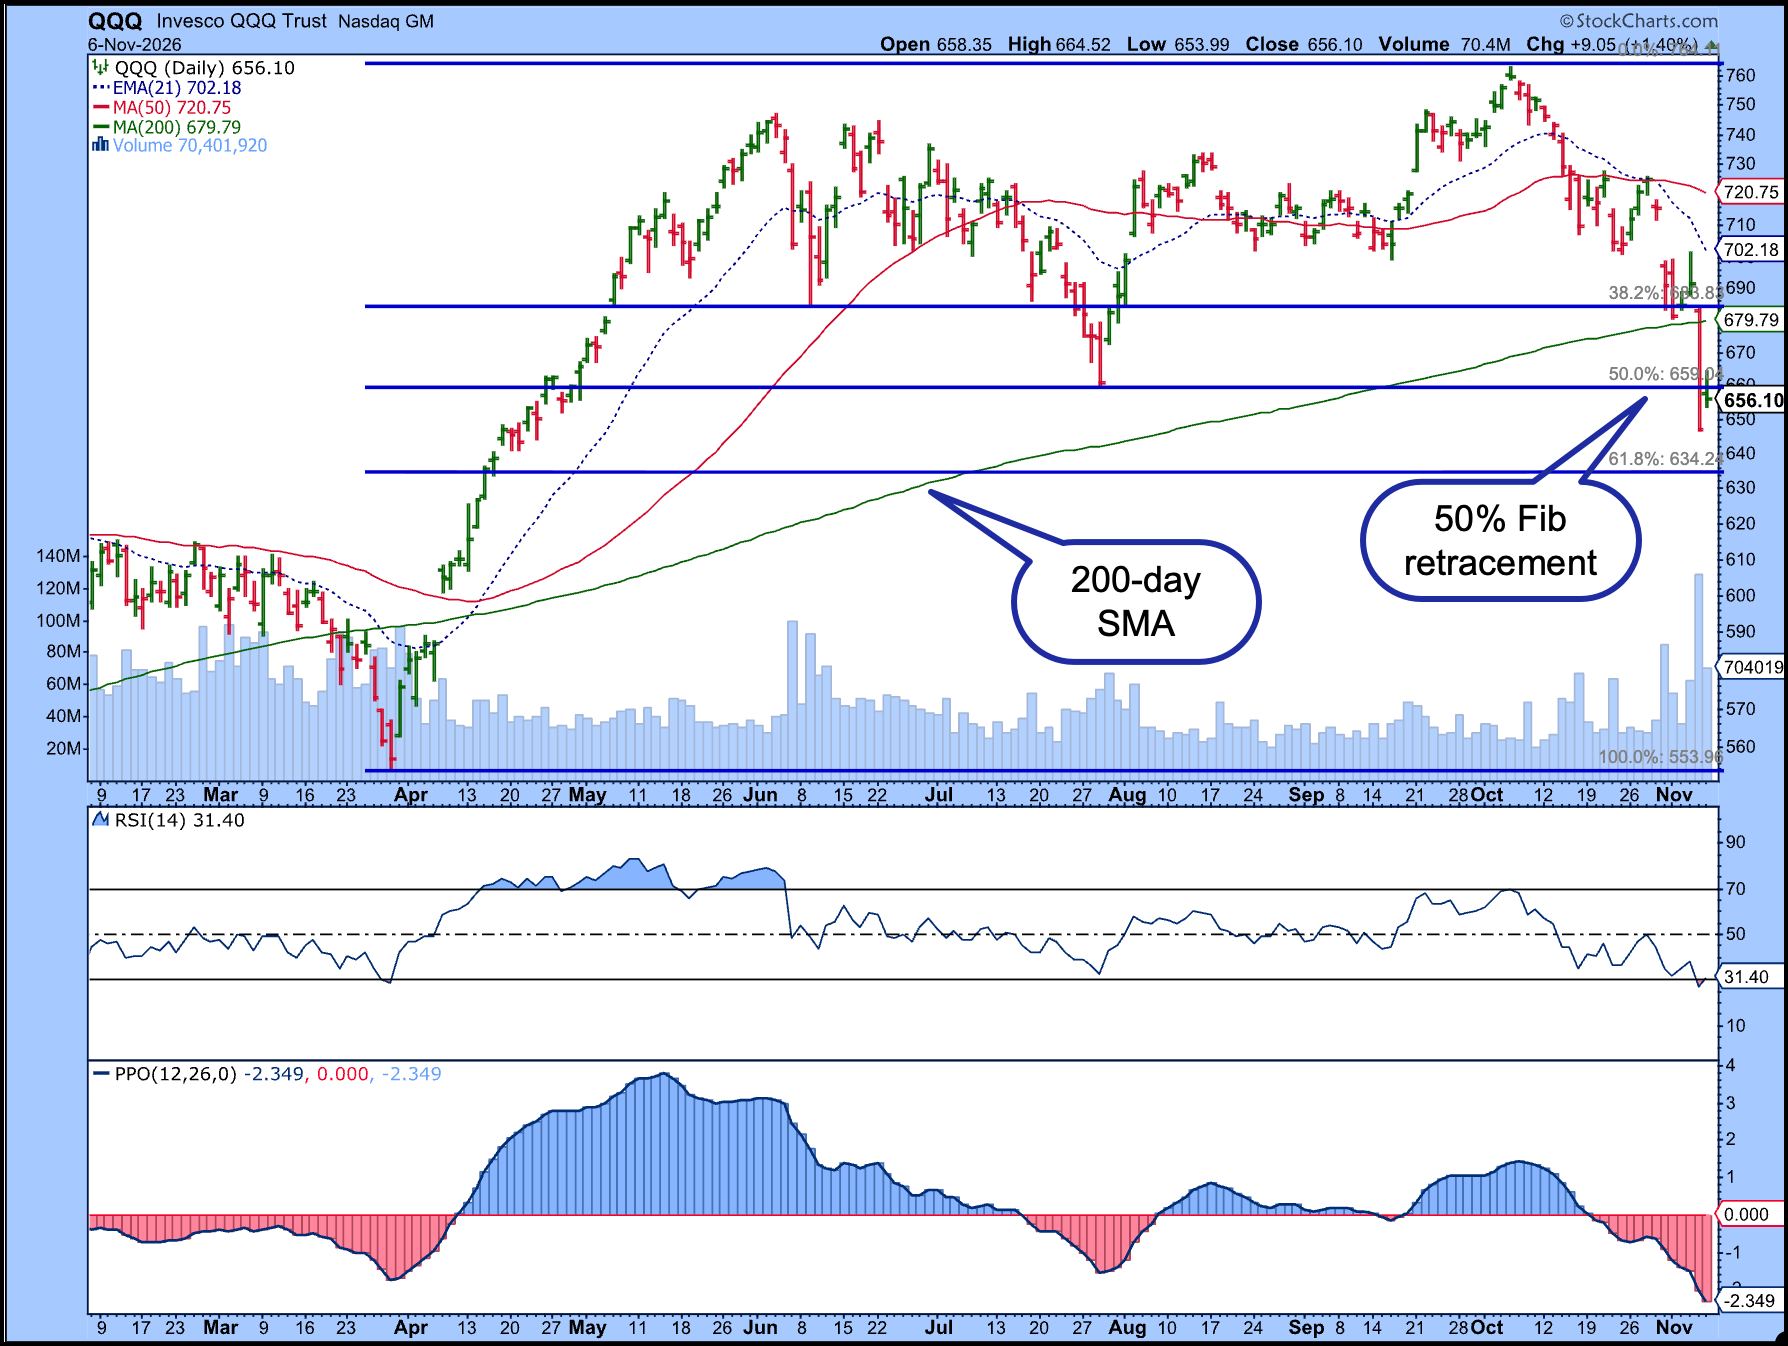
The Nasdaq 100 ($NDX), with its heavy concentration of technology stocks, is a good place to start. The Nasdaq 100 has fallen below its 200-day simple moving average (SMA) and the 50% Fibonacci retracement level, measured from the March low to the October high.
Look at the last two bars on the chart. On Friday, the index climbed above the 50% Fib retracement level, but couldn’t hold those gains into the close.
The index has been trading lower since early October, forming a series of lower highs and lower lows. One of the first red flags appeared when the 21-day exponential moving average (EMA) crossed below the 50-day SMA. Even then, the Nasdaq 100 managed to stay above its 200-day SMA and the 38.2% Fibonacci retracement level.
Then came Thursday. The Nasdaq 100 broke below its 200-day SMA and the 50% Fib retracement level, weakening the technical structure. Momentum has slowed, as seen by the RSI and PPO.
We could see more selling in the days ahead. On the other hand, buyers may decide that prices have fallen far enough and begin accumulating positions. I’m not convinced Friday’s action was a sign that investors were buying the dip. The day’s open and close were very close to each other, which suggests there was more short covering than investors rushing to buy.
What’s working in this market?
Just because technology stocks are struggling doesn’t mean you should abandon the stock market. It means you should look beyond technology stocks and find out where money is flowing. That’s where StockCharts can give you an edge.
I spent some time exploring the scans in our Sample Scan Library, looking for stocks outperforming the SPDR S&P 500 ETF (SPY). You can try this yourself. Go to Scans & Alerts, open the Library, then the New Highs menu, and explore the scans under Market Leaders.
I was surprised by how many stocks appeared in those results. In the 52-week relative highs scan, 40 stocks were outperforming the SPY, which is impressive, considering the beating the broader market has taken. When I sorted the stocks by sector, I noticed several of them belonged to the Health Care sector.
If technology stocks continue to show signs of weakness next week, it may be worth considering whether sectors that are showing relative strength, such as Health Care, deserve more exposure in your portfolio.
Your money, your decisions
Even in a difficult market, there are stocks holding their ground and showing strength. You just have to find them.
You've got the tools, so spend some time exploring them and getting comfortable with them. When it comes to managing your money, you're the one who has to make the decisions. You can't rely on automated programs or AI agents.
💡
New to StockCharts? Don’t miss our upcoming New User Webinar. Join Chief Strategist Grayson Roze on Friday, November 13, 2026, from 1:00 PM to 2:00 PM ET for a guided walkthrough of the tools that matter most, so you can start getting full value from your membership right away. Seats are limited. Save your spot now.
Semiconductor stocks sold off sharply this week, but some sectors are showing strength. Tom Bowley shows you which sectors are likely to perform well post-midterm elections. ...
The S&P 500 has broken key support as AI stocks struggle, raising the risk of further declines. Dave Keller, CMT highlights Kroger, Visa, and Waters as three stocks demonstrating strong technical trends and improving relative strength despite broader market weakness. ...
Small- and mid-cap stocks are at inflection points. Arthur Hill analyzes the charts of small- and mid-cap stocks and identifies the key levels to watch for breakouts. ...
Stocks rebounded after Tuesday's midterm-election results. The S&P 500 needs to overcome strong resistance, Treasury yields and the US dollar are close to key support levels, and gold prices rise. ...
After a sharp decline, Brazilian equities could present a short-term buying opportunity. Martin Pring analyzes the chart of the Bovespa and EWZ presents a short and long-term picture. ...
Before We Dive In…
You hear it every election season: “Stocks rally after midterms.” It's a claim that’s often backed by almanac stats, bank analysts, and some academic research [1]. But is it true? And if it is, what does it look like in terms of timing ...
As a StockCharts Member, you unlock all of our most powerful tools and features, including saved charts and settings, custom scans, technical alerts and much more. Discover all that StockCharts can do with our
free 1-month trial and start charting like a true market pro.