Art's Charts March 31, 2010 at 04:30 AM
Yesterday I showed a rising price channel extending from August and SPY was consolidating near the upper trendline. No change on that front as SPY continued its stall with another relatively narrow range day. Monday's high-low range was the narrowest in seven days (NR7)... Read More
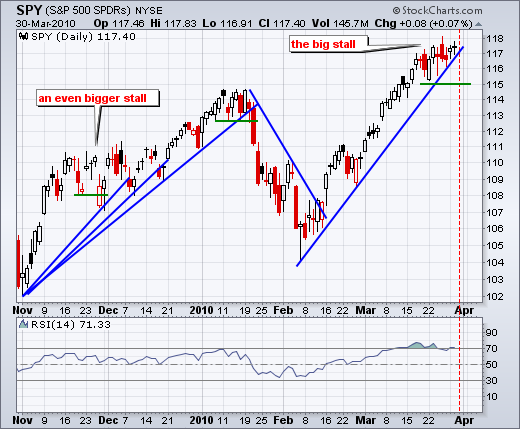
Art's Charts March 30, 2010 at 04:29 AM
I will start with the chart shown in yesterday's Market Message. There is no new price action so the analysis has not changed. SPY hit the upper trendline of a rising price channel and stalled over the last two weeks. Stalling is not the same as weakness though... Read More
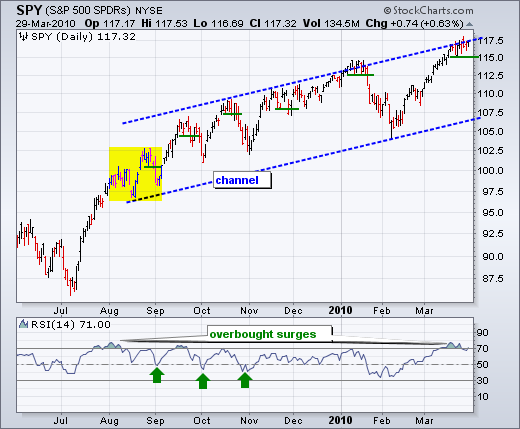
Art's Charts March 29, 2010 at 05:26 AM
There is really no change on the daily chart. SPY remains in a medium-term uptrend with a higher low in February and higher high in March. The ETF is also in a short-term uptrend with a sharp advance from the February low... Read More
Art's Charts March 26, 2010 at 06:19 AM
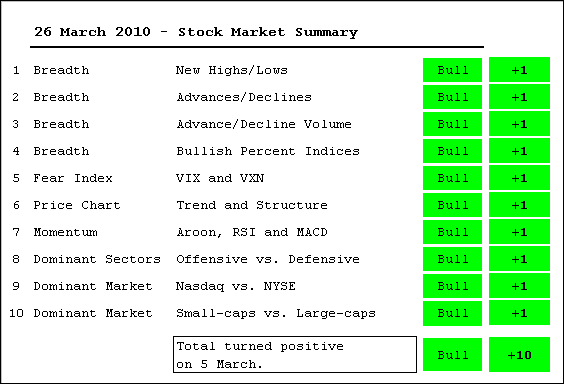
There is no change in the Stock Market Summary this week. All indicators are in bull mode, but there were some signs of less strength this week. The NYSE AD Volume Line did not exceed last week's high... Read More
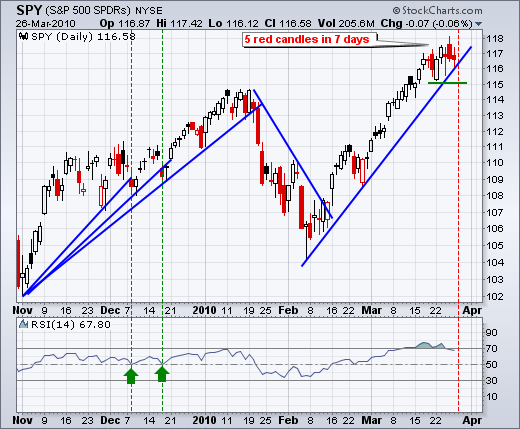
Art's Charts March 26, 2010 at 05:12 AM
Trading is turning rather volatile, which is just one more sign that a pullback or corrective period may begin soon. SPY first crossed above 116.5 seven days ago. Since this first cross, the ETF has dipped to around 115 and surged above 118. Yesterday's close at 116... Read More
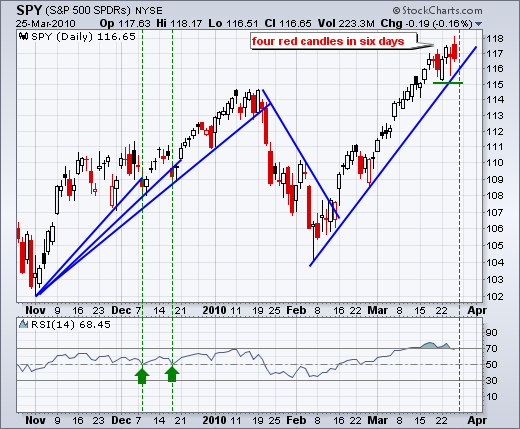
Art's Charts March 25, 2010 at 05:06 AM
As with the end of February, SPY is currently stalling within an uptrend. The ETF moved above 116 six days ago and has traded on either side of 116.5 the last six days. The pink ovals show periods with a red candlestick, recovery candlestick and a subsequent gain... Read More
Art's Charts March 25, 2010 at 03:46 AM
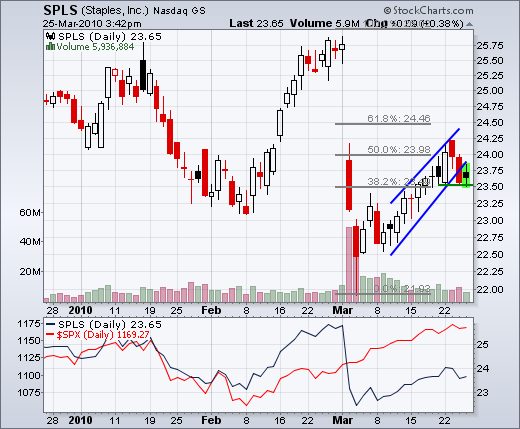
After a sharp decline with a gap in early March, Staples (SPLS) retraced 50-62% with a rising flag over the last 2-3 weeks. The stock broke the lower flag trendline with a sharp decline on Wednesday, but firmed at support around 23.5 on Thursday... Read More
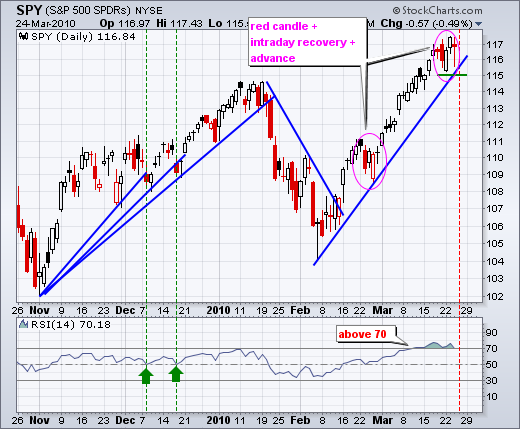
Art's Charts March 24, 2010 at 05:19 AM
There it is again. After one long red candlestick, SPY opened weak and closed strong. This intraday reversal was followed by further gains on Tuesday as the ETF moved above 117 for the first time since September 2008, which was when Lehman declared bankruptcy... Read More
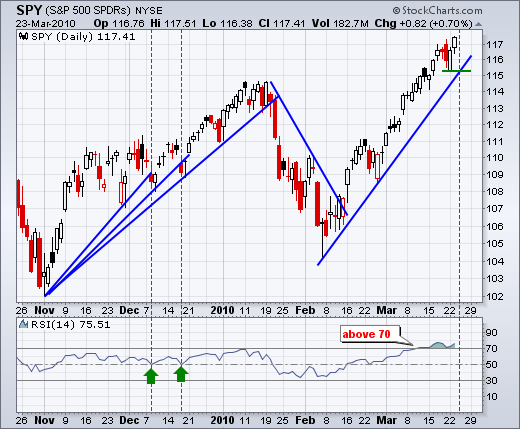
Art's Charts March 23, 2010 at 05:15 AM
Even after a high-volume bearish engulfing on quadruple witching Friday and weak open on Monday, the bulls refused to give up the trend and pushed stocks higher immediately after the open. One day does not a trend change make... Read More
Art's Charts March 22, 2010 at 05:45 AM
Stocks fell on Friday with the highest volume since early February, which was the scene of the last reversal. High volume sometimes marks a turning point. Stockcharts.com provides volume figures for the S&P 500, Dow Industrials, Nasdaq 100, Nasdaq and NYSE... Read More
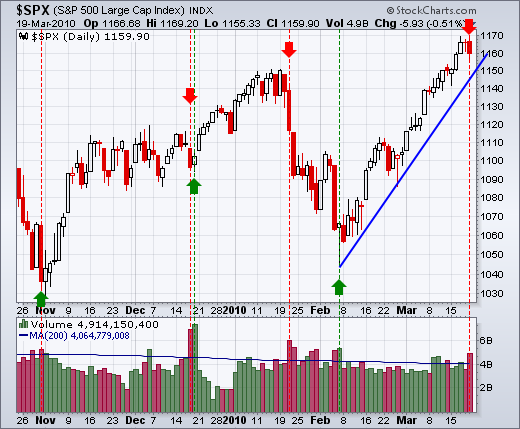
Art's Charts March 19, 2010 at 06:12 AM
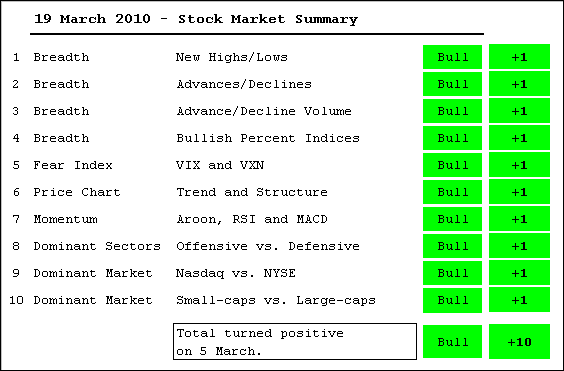
There is no change in the Stock Market Summary this week. All indicators are in bull mode with no signs of weakness within the market. After a sharp advance the last three weeks, the major index ETFs are short-term overbought and ripe for a pullback or consolidation... Read More
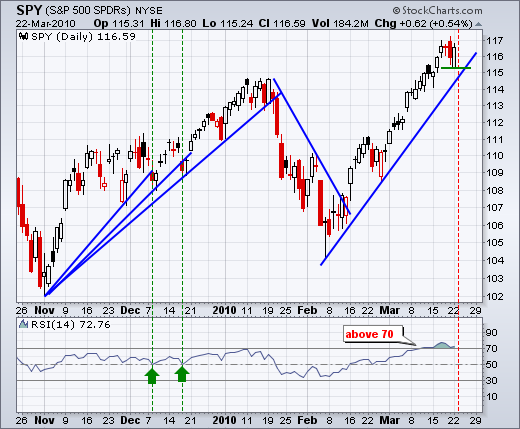
Art's Charts March 19, 2010 at 05:20 AM
The S&P 500 ETF (SPY) finally broke its string of advances with a small decline on Thursday. And I do mean small. DIA, QQQQ and IWM were up fractionally on the day. The sectors were mixed with five down and four up... Read More
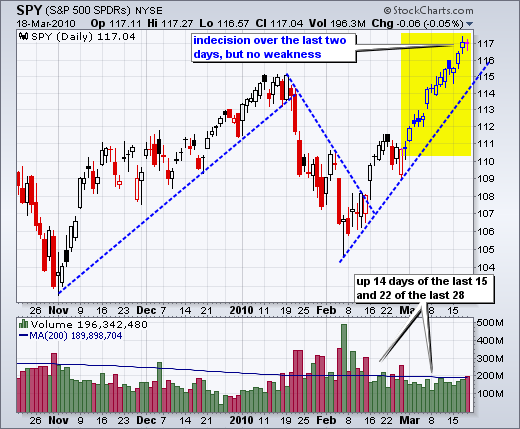
Art's Charts March 18, 2010 at 04:40 AM
The S&P 500 ETF (SPY) continued higher with a close above 117. Even though the ETF closed up on the day, the candlestick was indecisive with a small body and relatively equal upper/lower shadows. Since the breakout at 108, I count six indecisive candlesticks... Read More
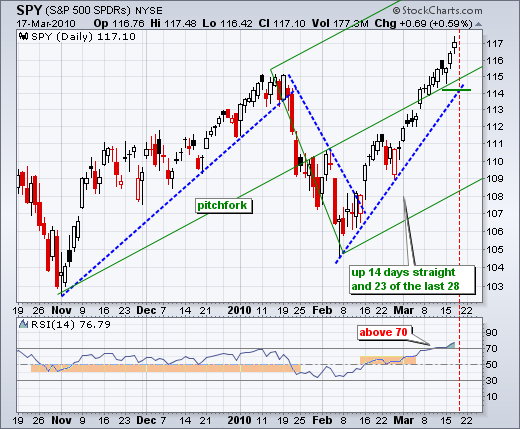
Art's Charts March 17, 2010 at 05:39 AM
The S&P 500 ETF (SPY) made it a lucky 13 with another advance on Tuesday. There are, hundreds, if not thousands, of indicators and drawing techniques available to the technical analyst. Chances are that one of these indicators or drawing techniques will pick the exact top... Read More
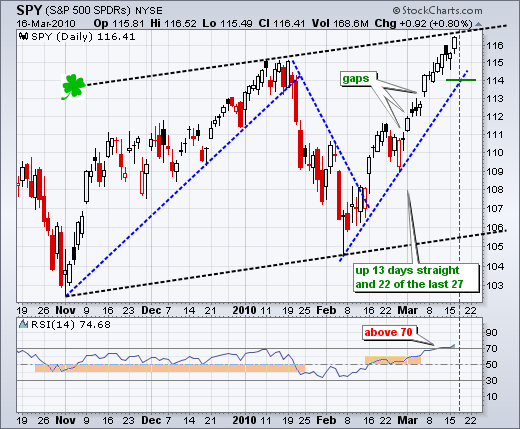
Art's Charts March 16, 2010 at 05:21 AM
The S&P 500 ETF (SPY) put another notch on its belt today with the 12th straight gain. As far as I can tell, September 1995 was the last such occurrence, after which SPY moved into a seven week trading range. I posted a chart of September 1995 in yesterday's Market Message... Read More
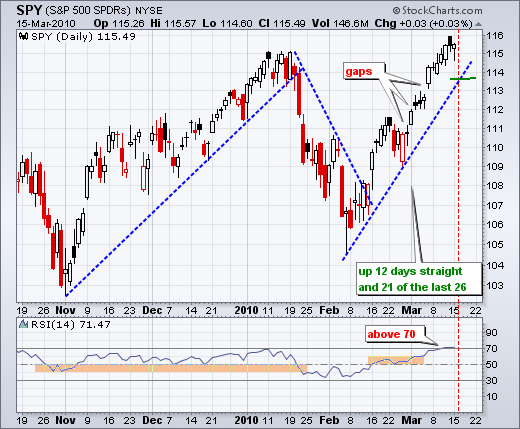
Art's Charts March 15, 2010 at 06:31 AM
With Friday's advance, the S&P 500 ETF (SPY) is now up 11 days straight and 20 of the last 25 days. It is an almost historic run. The ETF was up 12 days straight on September 13th, 1995... Read More
Art's Charts March 12, 2010 at 04:46 AM

All stock market indicators are in bull mode. Before moving to the details, note that two indicators have been removed. The McClellan Oscillators were removed because they are redundant breadth indicators. The AD Lines represent a purer picture of the advance-decline metrics... Read More
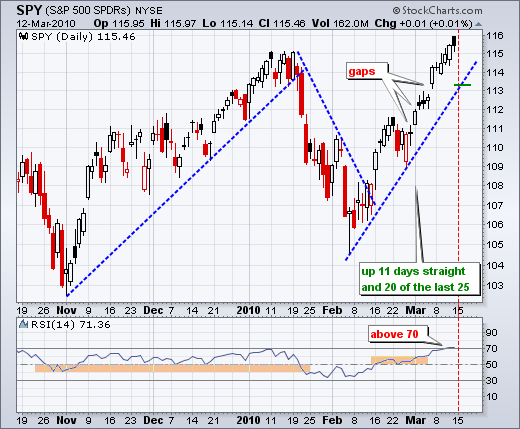
Art's Charts March 12, 2010 at 03:28 AM
With Thursday's advance, the S&P 500 ETF (SPY) is now up 10 of the last 10 days and 19 of the last 24. This is an amazing string of advances. In fact, I would say it is starting to look like a melt-up, which is the opposite of a selling climax. With the close at 115... Read More
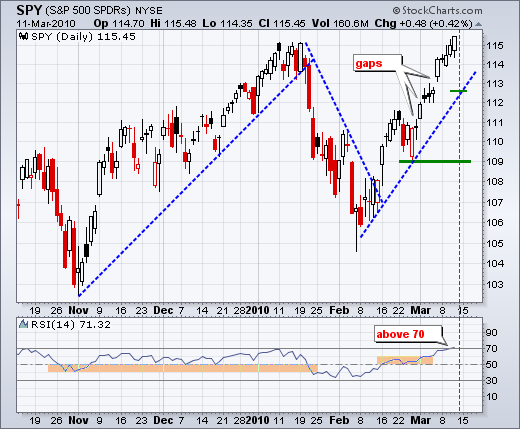
Art's Charts March 11, 2010 at 04:32 AM

There was another challenge to the January high as the S&P 500 ETF (SPY) gained around 1/2% to close at 114.97. For all intents and purposes, SPY has reached the January high. However, it has yet to exceed the January high... Read More
Art's Charts March 10, 2010 at 04:16 AM
After moving sharply higher in early trading, stocks turned lower in the afternoon and finished mixed on the day. All major indices finished fractionally higher, but the sectors were mixed with three up, five down and one unchanged... Read More
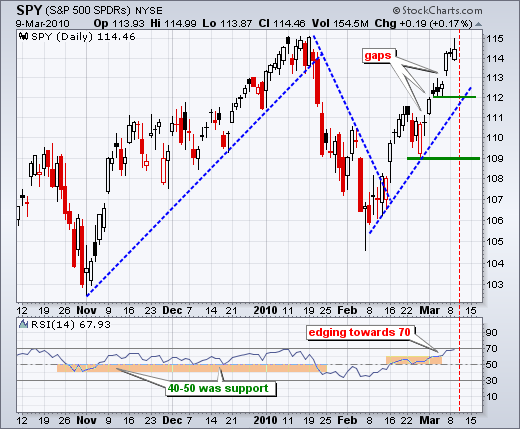
Art's Charts March 09, 2010 at 04:29 AM
After a gap and surge above 114 on Friday, the S&P 500 ETF (SPY) stalled with a small doji on Monday. This is hardly surprising given potential resistance near the January high and short-term overbought conditions. SPY is up over 7% since mid February and up over 3... Read More
Art's Charts March 08, 2010 at 05:09 AM
Stocks surged with a better-than-expected employment report on Friday. The Russell 2000, S&P 500 Equal-Weight Index, Nasdaq 100 Equal-weight Index and S&P 400 MidCap Index all recorded new 52-week highs... Read More
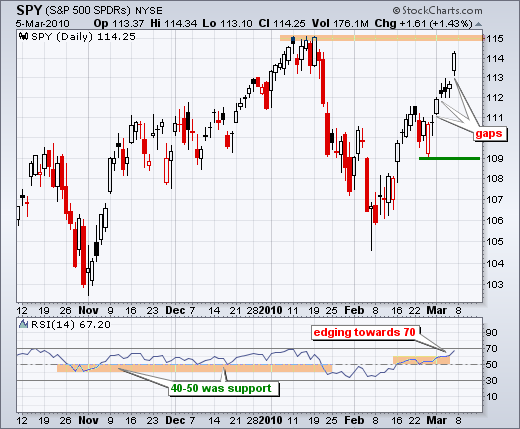
Art's Charts March 05, 2010 at 05:57 AM
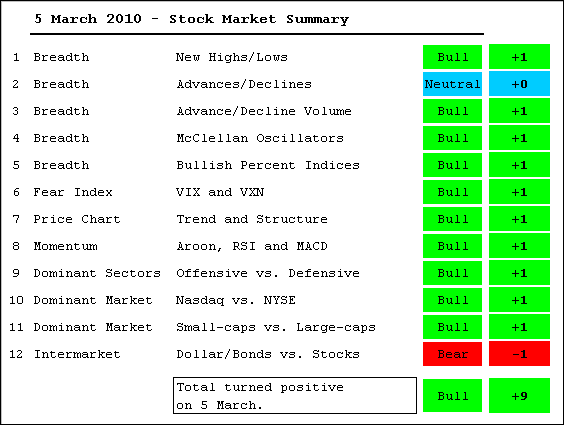
With further strength this week, the market summary table moved from -2 to +9. The only negative indications come from the Nasdaq AD Line and strength in the Dollar. In addition, relative weakness in the large-cap indices (SPY and DIA) is a concern... Read More
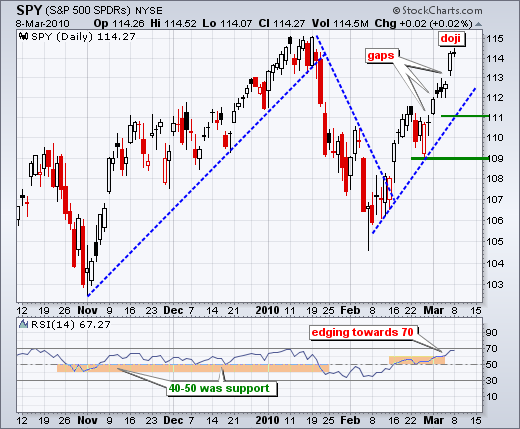
Art's Charts March 05, 2010 at 04:01 AM
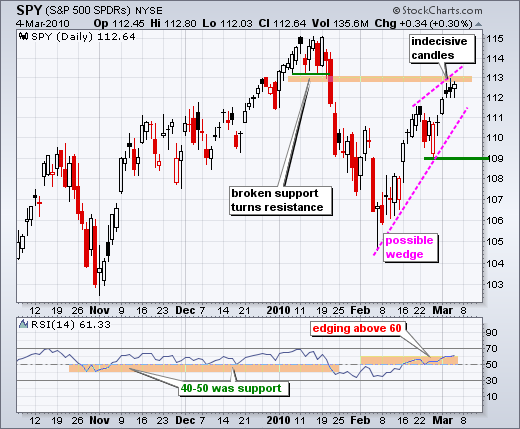
The S&P 500 ETF (SPY) stalled for the third day running as the ETF formed its third indecisive candlestick in a row. While this indecision can sometimes foreshadow a reversal, stalling is not the same as weakness... Read More
Art's Charts March 04, 2010 at 04:31 AM
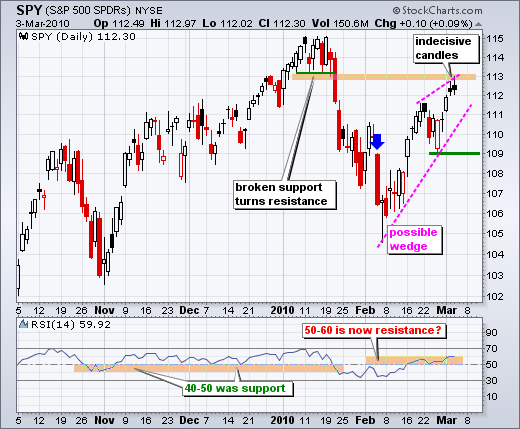
For the second day running, the S&P 500 ETF (SPY) stalled with an indecisive candlestick. Notice the small body (open-close) and the modest upper-lower shadows (intraday high-low). These candlesticks show a stalemate between buyers and sellers... Read More
Art's Charts March 03, 2010 at 05:01 AM
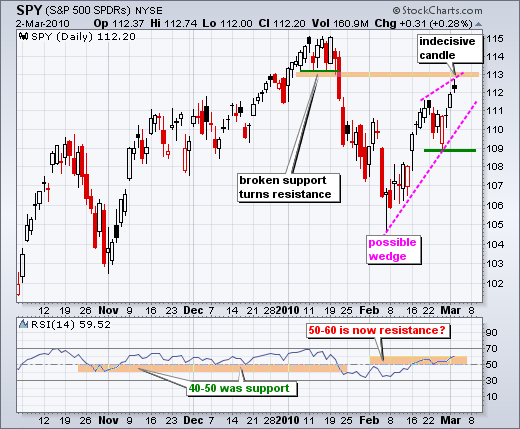
Technically, there is a case for a medium-term uptrend. SPY recorded a 52-week high in January and the February reaction low is above the early November reaction low... Read More
Art's Charts March 02, 2010 at 04:41 AM
Stocks moved higher on Monday with broad participation. All of the major indices were up 1% or more. All sectors were up with the Consumer Discretionary SPDR (XLY) leading the way. The Financials SPDR (XLF), however, was clearly the weakest link with a fractional gain (+.27%)... Read More
Art's Charts March 01, 2010 at 07:27 AM
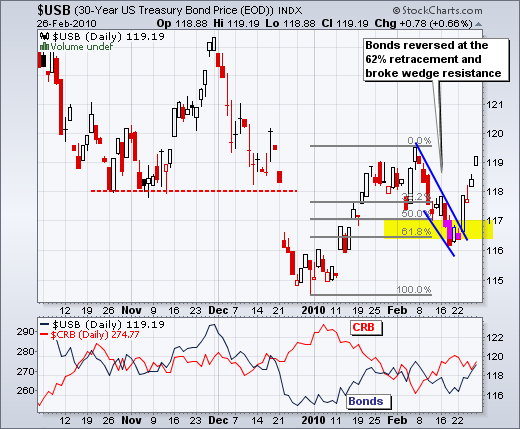
All daily and weekly intermarket charts have been updated ( click here). Below for four charts featuring some highlights from last week. Bonds had a big week as the 30-year Treasury Bond ($USB) surged over 2%... Read More
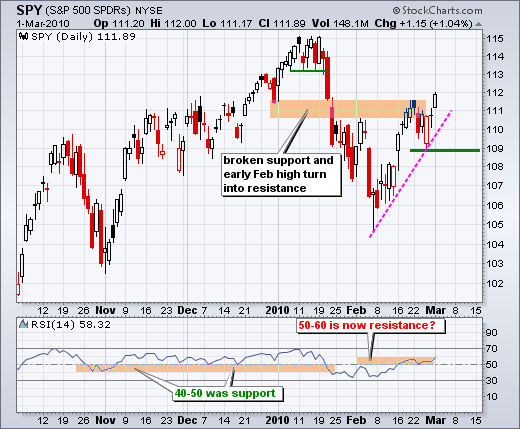
Art's Charts March 01, 2010 at 04:47 AM
On the daily chart, SPY surged to resistance around 111 and then consolidated the last few days. The ETF appeared headed down after a sharp decline on Tuesday and weak open on Thursday, but recovered on Thursday afternoon and closed strong... Read More