Art's Charts April 30, 2010 at 05:24 AM
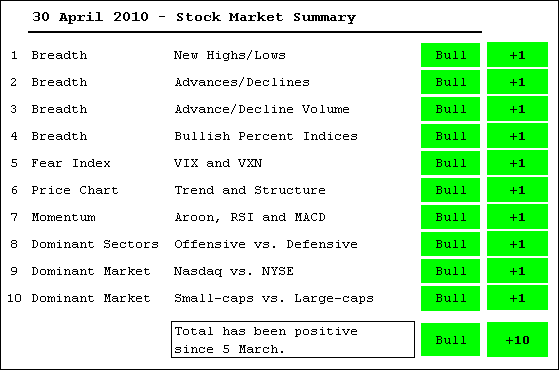
There is no change in the Stock Market Summary this week. The bulk of the evidence turned bullish again on March 5th and remains bullish. All 10 indicators are in bull mode... Read More
Art's Charts April 30, 2010 at 03:56 AM
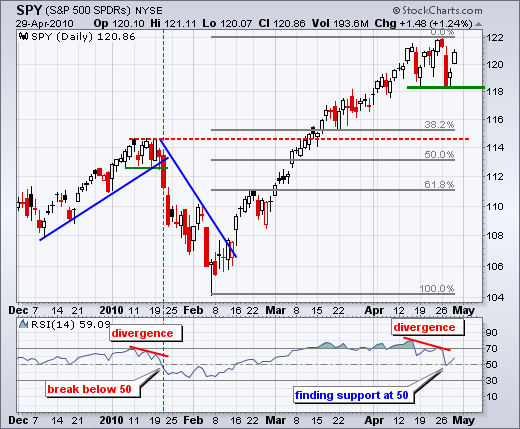
Overall, the trend on the daily chart remains up. SPY forged a higher high last week and held short-term support this week... Read More
Art's Charts April 29, 2010 at 04:10 AM
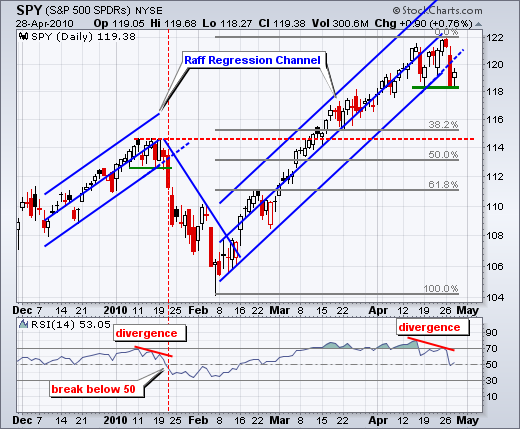
That is the question. The S&P 500 ETF (SPY) became short-term oversold after a sharp decline on Tuesday and then firmed with an indecisive candlestick on Wednesday. Taken together, we have a harami or inside day. In addition, the ETF has support around 118... Read More
Art's Charts April 28, 2010 at 03:44 AM
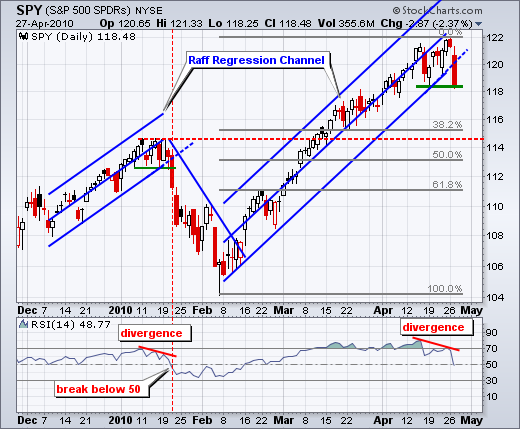
With a gap down and long red candlestick, the S&P 500 ETF (SPY) broke below the lower trendline of the Raff Regression Channel. This is the second long red candlestick (sharp decline) in two weeks... Read More
Art's Charts April 27, 2010 at 04:14 AM
There is overbought and then there is OVERBOUGHT. Overbought conditions after a two week surge show early inning strength, but overbought conditions after a seven week surge show maturity in the late innings (baseball)... Read More
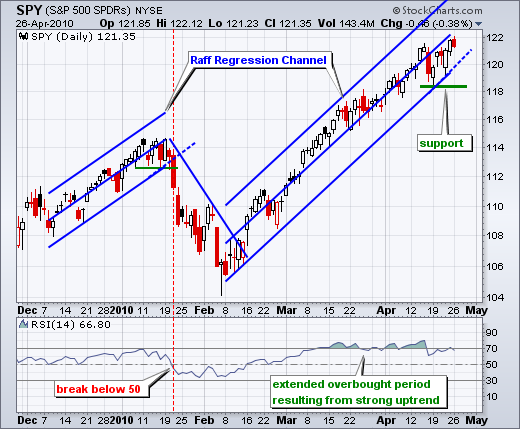
Art's Charts April 26, 2010 at 06:02 AM
With another strong week, the S&P 500 ETF (SPY) surged to a new closing high for the move. The ETF was up four of five days and gained over 2%. Reaction to last week's earnings reports and news was positive overall... Read More
Art's Charts April 23, 2010 at 04:11 AM
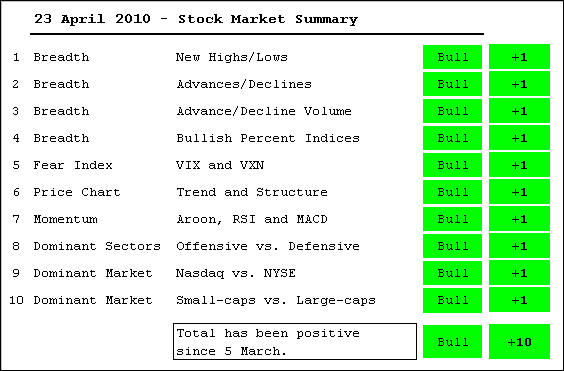
There is no change in the Stock Market Summary this week. The bulk of the evidence turned bullish again on March 5th and remains bullish. All 10 indicators are in bull mode. The only potential negative is the frothiness of the current advance... Read More
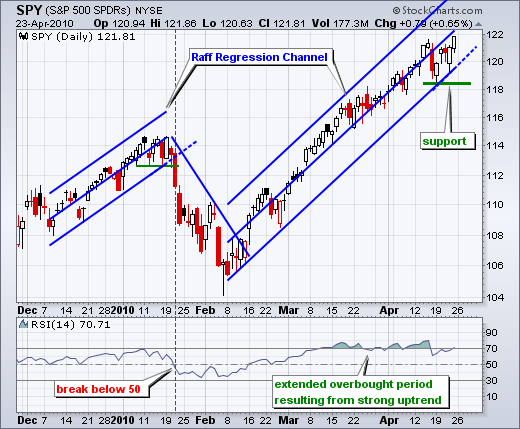
Art's Charts April 23, 2010 at 03:34 AM
After a gap down and weak open, the S&P 500 ETF (SPY) firmed throughout the morning and then surged in the late afternoon to close positive. Once again, the bulls remain resilient as even the smallest dips bring out the buyers... Read More
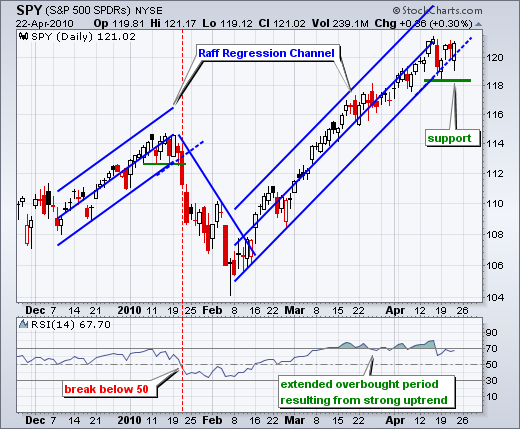
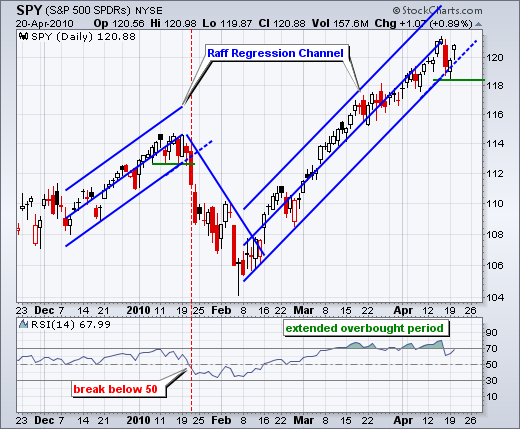
Art's Charts April 22, 2010 at 05:47 AM
There is no change on the daily chart as SPY remains just above the Raff Regression Channel extension. SPY affirmed channel support with a reversal day on Monday and bounced on Tuesday... Read More
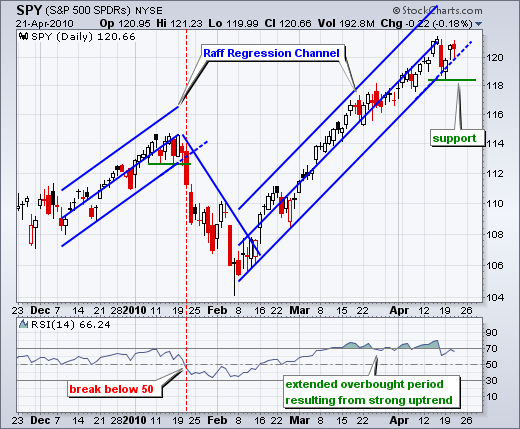
Art's Charts April 21, 2010 at 05:07 AM
We made it through the ash cloud and I am back at the office with my normal work setup (computers, big monitors, Nespresso, etc...). Office sweet office! After a sharp decline on Friday, SPY recovered from early weakness on Monday and extended its gains on Tuesday... Read More
Art's Charts April 19, 2010 at 12:22 PM
Note that Net Advances on the Nasdaq and NYSE plunged to their lowest levels since February. Net Advancing Volume on the NYSE and Nasdaq also plunged to its lowest level since February... Read More
Art's Charts April 19, 2010 at 04:04 AM
After being stranded for a few days, we finally caught a flight home that will arrive on Tuesday. Unfortunately, I will not be able to provide an SPY update on Tuesday... Read More
Art's Charts April 18, 2010 at 09:46 AM
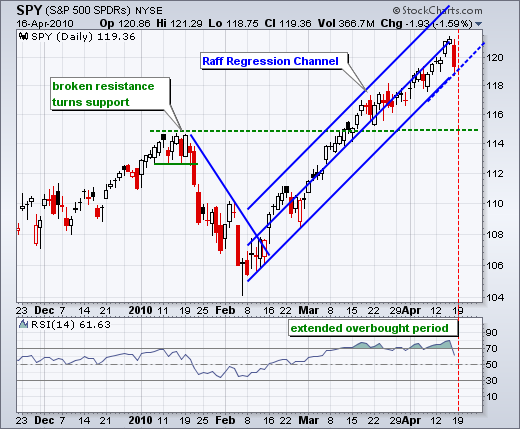
I am almost back in the saddle. Vacations are great, but it usually takes a day or two to get re-acclimated to the market environment. Stocks remained strong the last two weeks as the major index ETFs hit new highs for the move last week... Read More
Art's Charts April 01, 2010 at 11:45 AM
I will be on vacation the first two weeks of April. The next posting to Art's Charts will be on Monday, April 19th... Read More
Art's Charts April 01, 2010 at 05:41 AM
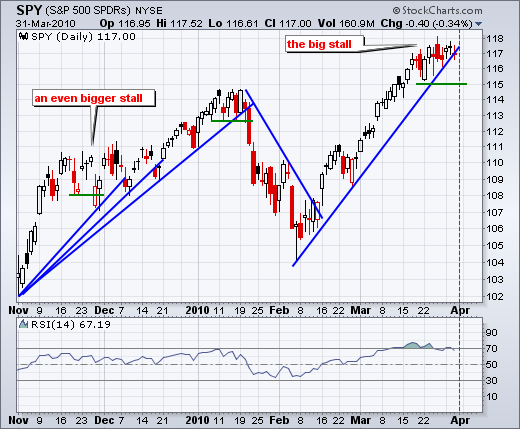
SPY hit 117 eleven days ago and then stalled the last 10 days. Daily ranges were relatively wide from March 19th until March 26th (six days). The daily range narrowed this week with three indecisive candlesticks... Read More