Art's Charts May 28, 2010 at 07:33 AM
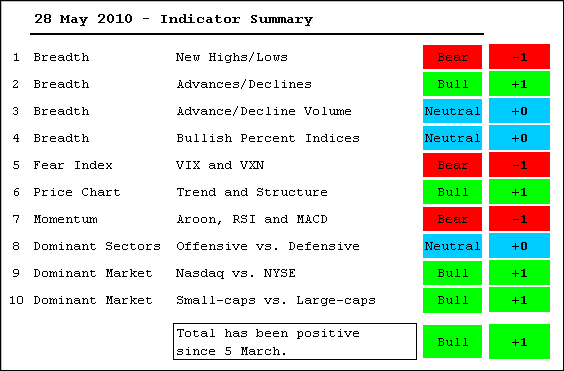
The Indicator Summary remains positive, just barely. I changed the name to better reflect the actual contents of the table. Two lagging indicators turned this week. Net New Highs turned bearish as the 10-day SMA moved into negative territory... Read More
Art's Charts May 28, 2010 at 03:49 AM
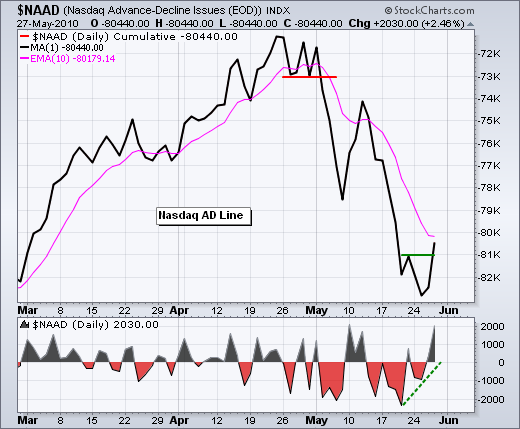
Stocks surged with a broad rally that lifted most boats. Over 90% of NYSE stocks advanced and over 85% of Nasdaq stocks were up on the day. Over 97% of NYSE volume was attributed to advancing issues. Over 90% of Nasdaq volume went into advancers... Read More
Art's Charts May 27, 2010 at 03:55 AM
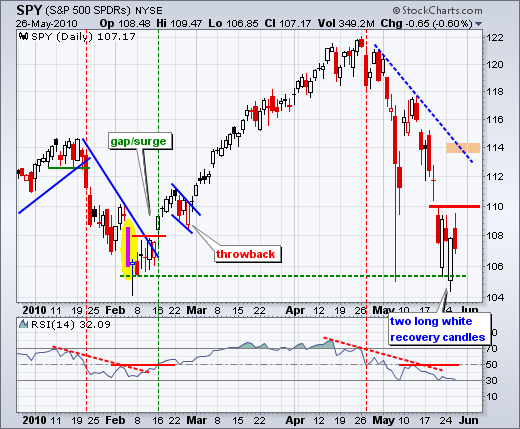
SPY followed through on Tuesday's reversal day with a surge above 109 in early trading, but failed to hold early gains and closed in negative territory for the day. It looks like a redux of Friday-Monday... Read More
Art's Charts May 26, 2010 at 04:48 AM
The pieces are in place for a short-term bounce, but we have yet to see the catalyst that actually reverses the 5-week downtrend. On the daily chart, SPY opened weak with a gap below last week's low and then rallied to close near the high for the day... Read More
Art's Charts May 25, 2010 at 04:42 AM
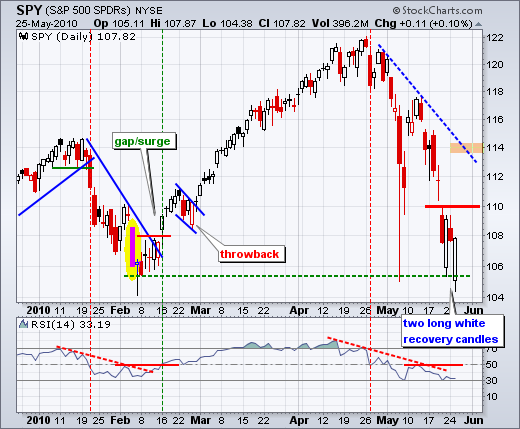
On the daily chart, SPY remains in a 4-5 week downtrend with support from the February lows close at hand. Support in the 106 area is confirmed by the February lows, the May flash-crash low and Friday's piercing line... Read More
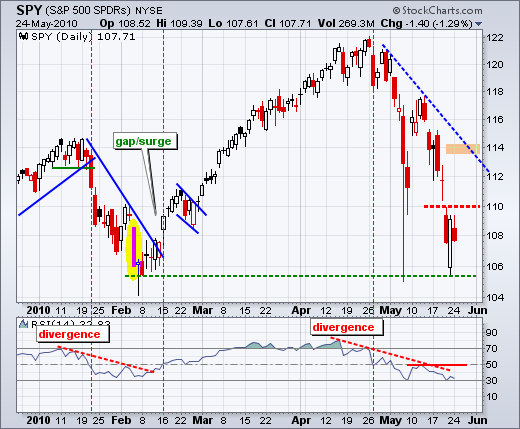
Art's Charts May 24, 2010 at 05:19 AM
The decline over the last four weeks was severe, but still within the realm of a bigger uptrend. The weekly chart still sports a series of higher highs and higher lows. A break below the February low is needed to end this series and call for the end of the major uptrend... Read More
Art's Charts May 21, 2010 at 07:46 AM
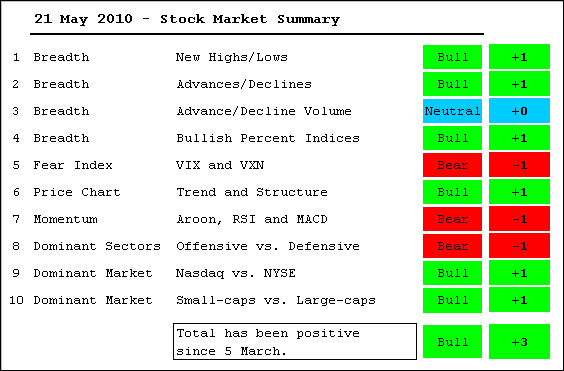
How can the evidence remain bullish after the April-May decline? Looking back at the evidence in early February, which turned negative after the Jan-Feb pullback, these are the indicator that turned bearish: the McClellan Oscillators, the S&P 500 Volatility Index ($VIX), momentum... Read More
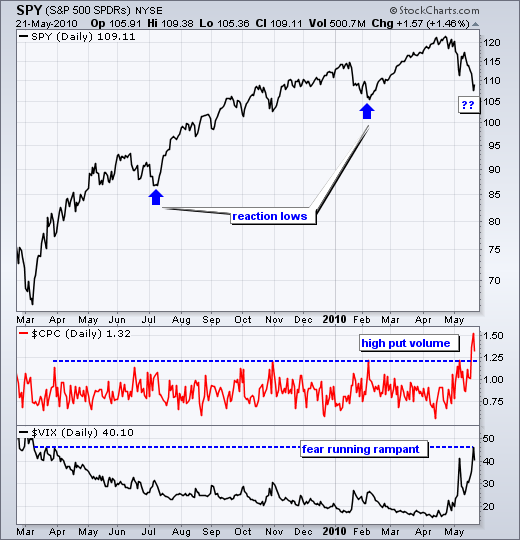
Art's Charts May 21, 2010 at 04:42 AM
With a gap down and 3.78% plunge, the S&P 500 ETF (SPY) is suddenly within a few percentage points of its February low. This reaction low defines the up trend on the weekly chart. A break below this low would reverse the uptrend that has been in place since March-April 2009... Read More
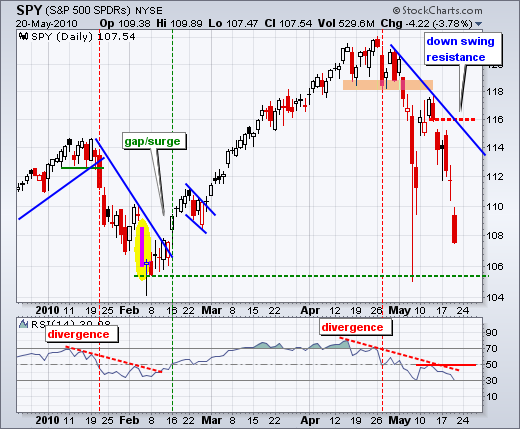
Art's Charts May 20, 2010 at 04:06 AM
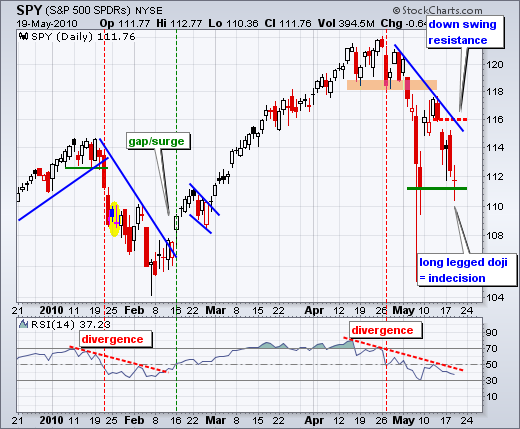
Indecision gripped the market yesterday as the S&P 500 ETF (SPY) formed a classic long legged doji. It is still unclear if these are bull legs or bear legs. The overall trend is down on the daily chart as SPY formed a lower high below 118 and gapped down last Friday... Read More
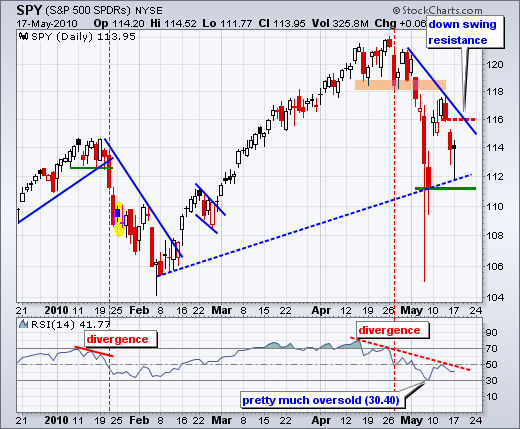
Art's Charts May 19, 2010 at 03:52 AM
After a mild recovery day on Monday, stocks opened strong on Tuesday with many of the major index ETFs gapping up. And that was it. These opening gaps, though modest, did not last more than an hour as stocks moved lower the rest of the day... Read More
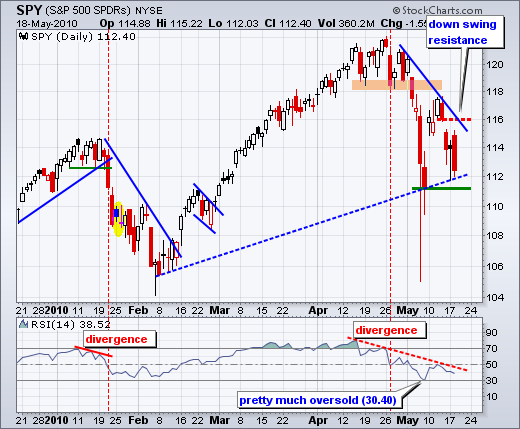
Art's Charts May 18, 2010 at 04:45 AM
SPY continued lower on Monday morning with a dip below 112. This put SPY close to the 7-May close at 111.26 and within the 7-May candlestick body. After dipping below 112 in the late morning, buyers stepped into the market and pushed SPY to 113.95 on the close... Read More
Art's Charts May 17, 2010 at 04:37 AM
Friday's action is continuing into Monday. As of 4AM ET, the Euro is getting slammed (1.227), gold is higher, US Treasuries are higher and oil is lower. Asian stocks followed Wall Street and Europe with sharp losses on Monday... Read More
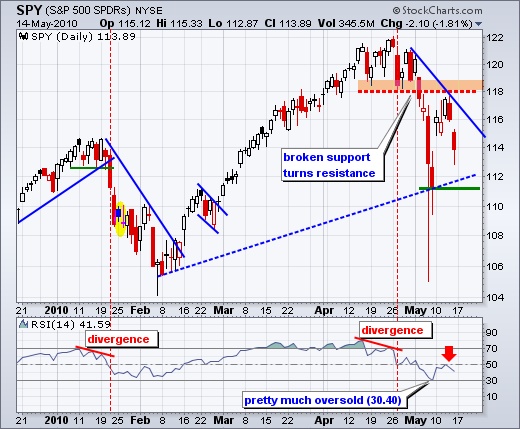
Art's Charts May 14, 2010 at 05:58 AM
After a drubbing over the prior two weeks, stocks rebounded with a sharp rally this week. For now, the drubbing was stronger than the rebound... Read More
Art's Charts May 14, 2010 at 04:48 AM
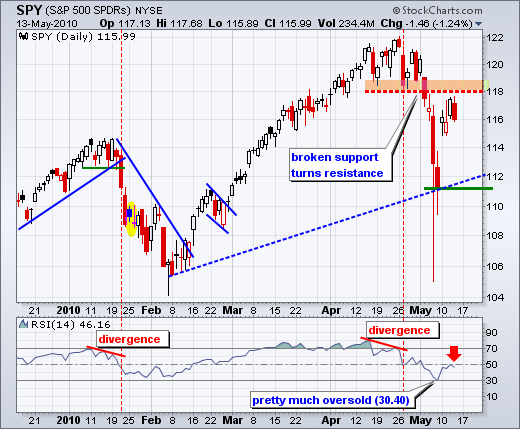
SPY edged above Wednesday's high yesterday, but late selling pressure drove the ETF below Wednesday's low. This weak close affirms resistance from broken support... Read More
Art's Charts May 13, 2010 at 05:53 AM
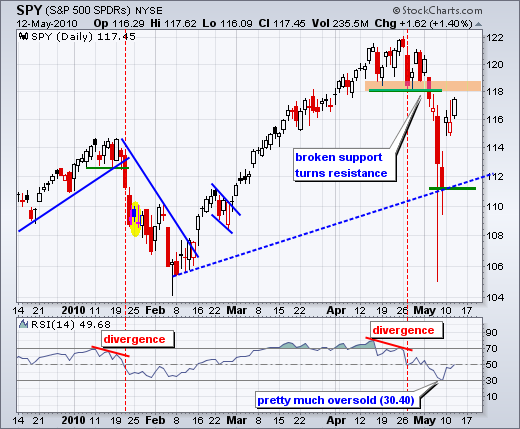
After some indecision around 116, the bulls reasserted themselves and pushed SPY another 1.40% higher on Wednesday. Monday's gap is holding and the cup remains half full. Over the last three days, SPY is up 5.56%, QQQQ is up 7.07% and IWM is up 9.58%... Read More
Art's Charts May 12, 2010 at 04:10 AM
Despite the big bailout package from the EU over the weekend, the Euro moved lower on Tuesday as Forex traders renewed selling pressure. Gold surged as a substitute for fiat currencies. Once again we have both the Dollar and gold moving higher... Read More
Art's Charts May 11, 2010 at 04:39 AM
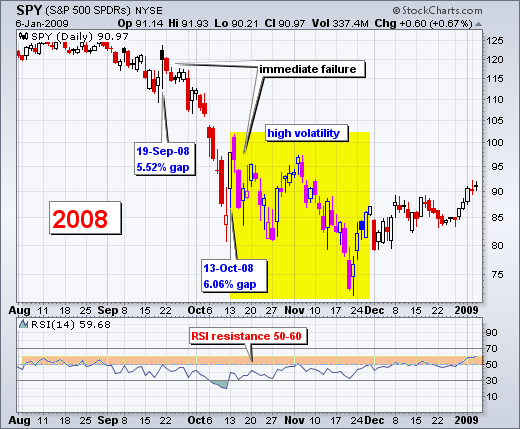
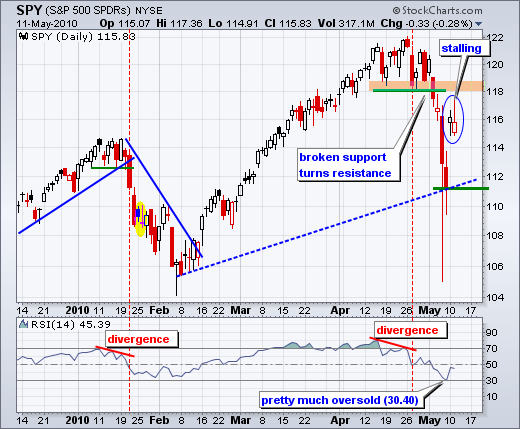
As expected, the S&P 500 ETF (SPY) gapped above 115 on the open with a 4.08% opening surge. This is the third biggest opening gap (up) in years, perhaps ever. SPY gapped up 5.52% on 19-Sep-08 and 6.06% on 13-Oct-08. Guess what? These gaps did not mark major lows... Read More
Art's Charts May 10, 2010 at 05:04 AM
Stock futures are trading sharply higher on news of a comprehensive $962 billion EU bailout package. As of 5AM ET, the Dow is up some 350 points, the S&P 500 is up 47, oil is up $3, gold is down $21, US bonds are down sharply, EU bonds are up sharply and the Euro is up sharply... Read More
Art's Charts May 07, 2010 at 05:23 AM
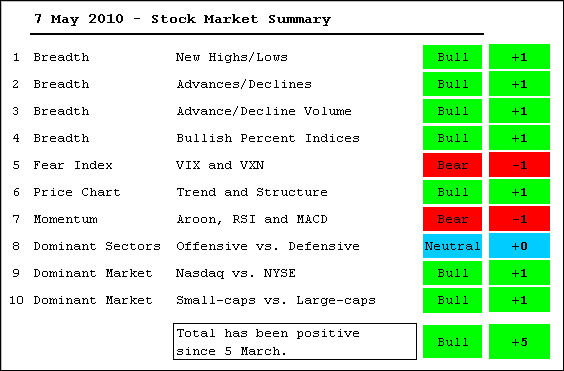
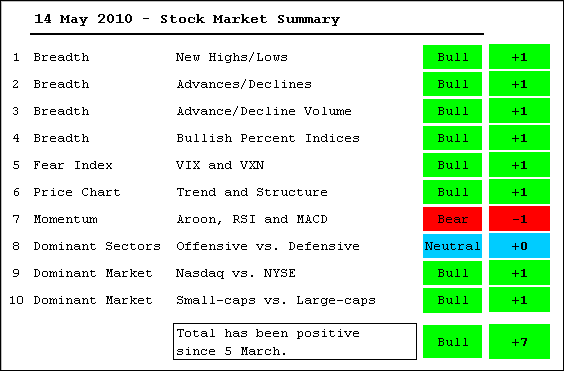
As deep as this week's decline has been, it was not enough to turn the position table net negative. The AD Lines and AD Volume Line were hit, but remain in uptrends and well above their February lows. Most of the Bullish Percent Indices are still above 50%... Read More
Art's Charts May 07, 2010 at 04:03 AM
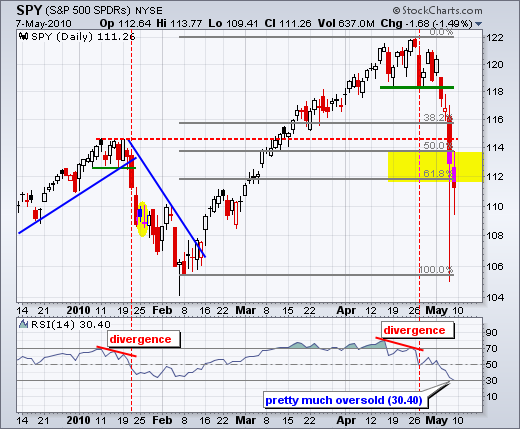
On the daily chart, the S&P 500 ETF (SPY) broke support from the mid April lows and plunged to the 50% retracement mark. I am not sure what to make of the intraday plunge below 106 - except that I would hate to have had a sell order filled at 106... Read More
Art's Charts May 06, 2010 at 04:40 AM
I don't usually start with fundamental items, but Friday could be a real doozy. First, the German parliament is scheduled to vote on the Greek bailout. Needless to say, the German public is not too happy about subsidizing early retirement (55) and other Greek benefits... Read More
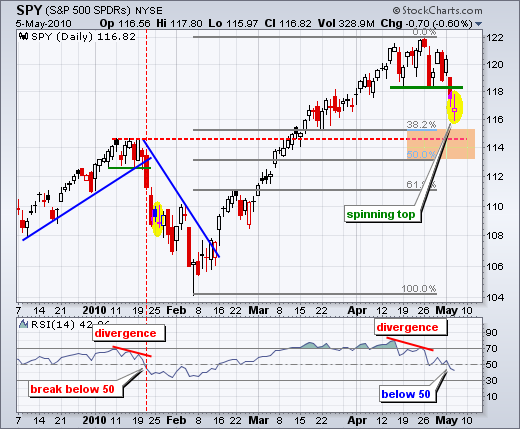
Art's Charts May 05, 2010 at 04:07 AM
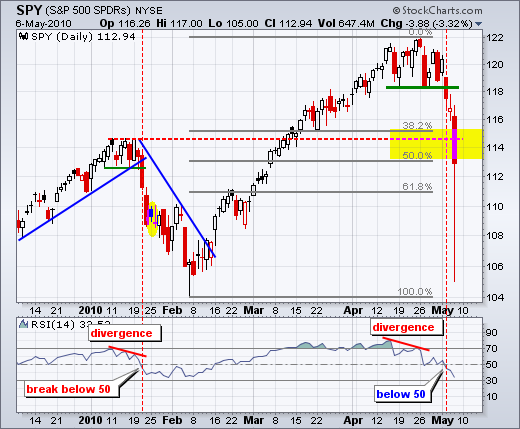
The S&P 500 ETF (SPY) broke range support with a gap down and long red candlestick. Selling pressure was broad based as all nine sectors were down. Healthcare held up the best with a .58% loss... Read More
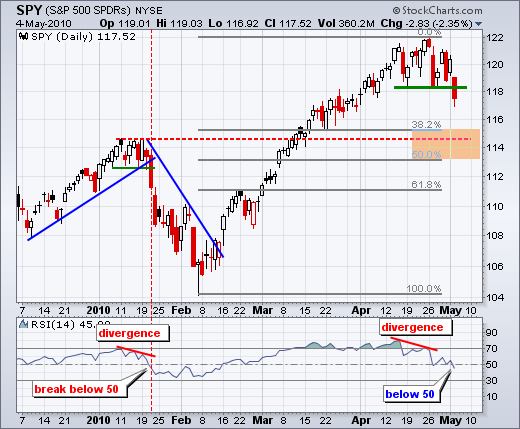
Art's Charts May 04, 2010 at 03:58 AM

SPY is going everywhere and nowhere at the same time. The ETF has moved on either side of 120 nine times in the last three weeks. Overall, the ETF has been stuck in a range bound by 122 on the top and 118 on the bottom (about a 3.33% range)... Read More
Art's Charts May 03, 2010 at 04:48 AM
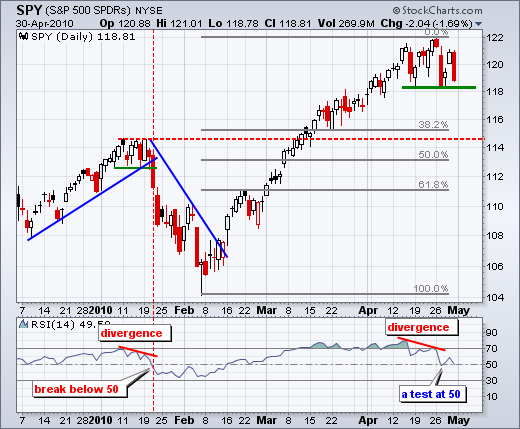
SPY is starting the week with a support test around 118. Also note that the Dow SPDR (DIA) and Nasdaq 100 ETF (QQQQ) are near range support today. There were a few bearish developments last week... Read More