Art's Charts August 31, 2010 at 05:18 AM
After big gains on Friday, stocks gave it back with big losses on Monday. A shallow pullback on modest breadth would have been positive, but yesterday's decline did not fit that bill... Read More
Art's Charts August 29, 2010 at 07:40 AM
After a rather volatile first hour on Friday, stocks found their footing and moved steadily higher throughout the day. Friday's action produced a few positives as we move into an important week. First, stocks managed to overcome early weakness. SPY moved below 104... Read More
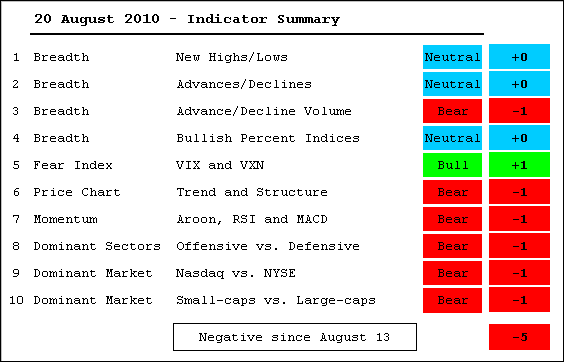
Art's Charts August 27, 2010 at 06:37 AM
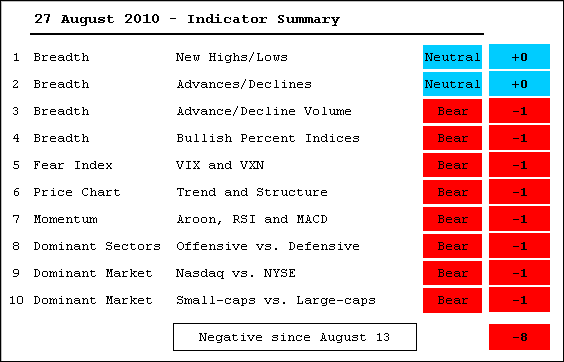
The indicator summary moved further into the red as the Bullish Percent Indices turned bearish and the S&P 500 Volatility Index ($VIX) broke above its mid July high. The NYSE AD Line and NYSE Net New Highs are the only two indicators keeping this summary from total negativity... Read More
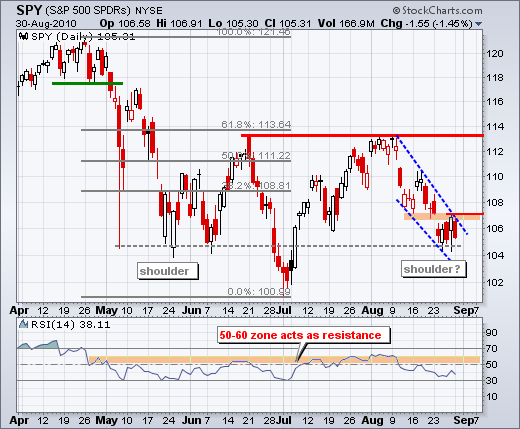
Art's Charts August 27, 2010 at 04:08 AM
Stocks started the day on firm footing after jobless claims were better-than-expected. However, the morning pop did not last long as SPY moved into negative territory by 11AM. Selling pressure continued throughout the day and the index closed near its lows... Read More
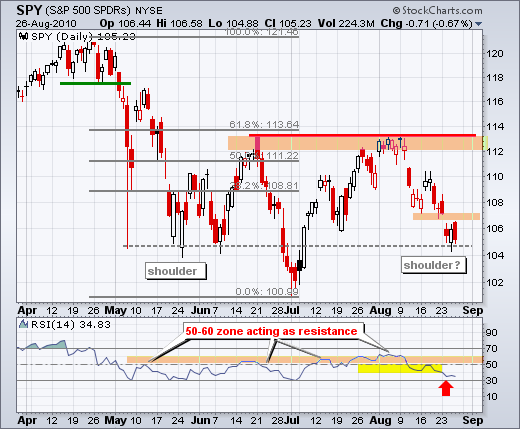
Art's Charts August 26, 2010 at 05:55 AM
Stocks started the day week, but recovered and closed near the highs for the day. The Dow SPDR (DIA) firmed near its mid July low, the Nasdaq 100 ETF (QQQQ) formed a bullish engulfing near its 62% retracement and the Russell 2000 ETF (IWM) bounced off its early July low... Read More
Art's Charts August 25, 2010 at 03:50 AM
With a gap down and sharp decline, the S&P 500 ETF (SPY) closed below 106 for the first time since early July. Selling pressure has been quite intense since August 9. SPY has closed down 9 of the last 11 days (red candlesticks) with three sizable down gaps along the way... Read More
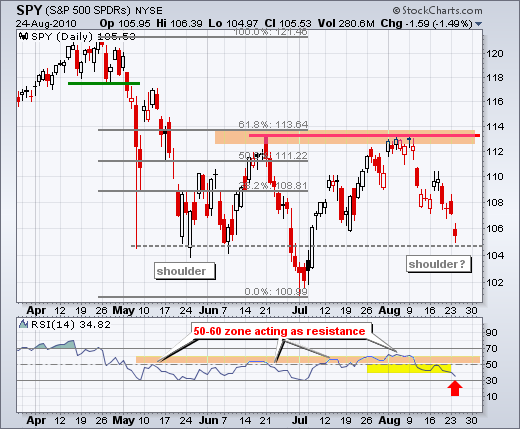
Art's Charts August 24, 2010 at 05:30 AM

Despite excessively bearish sentiment, the technical conditions in the stock market are clearly bearish for the short-term and medium-term. Sentiment is hard to quantify, but I get the feeling that sentiment is overwhelmingly bearish as we head into the September-October period... Read More
Art's Charts August 23, 2010 at 05:04 AM
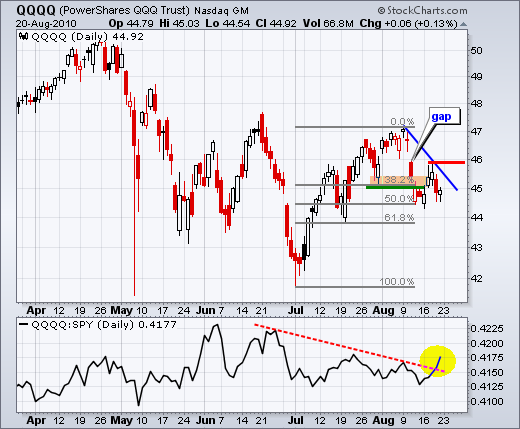
The August trend remains down for the major index ETFs, but techs are starting to show relative strength with QQQQ edging higher on Friday. Despite some signs of firmness, we have yet to see any signs of significant strength that would warrant a bullish stance... Read More
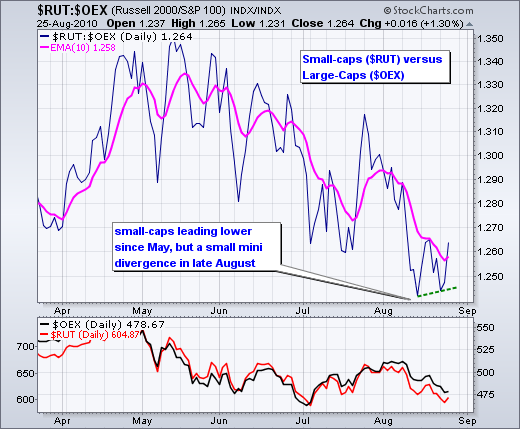
Art's Charts August 20, 2010 at 04:47 AM
The indicator summary would be much more negative were it not for strength in the NYSE breadth statistics. NYSE Net New Highs remain positive and the AD Line has yet to break down. Another decline next week would likely push these two indicators into bear mode... Read More
Art's Charts August 20, 2010 at 03:59 AM
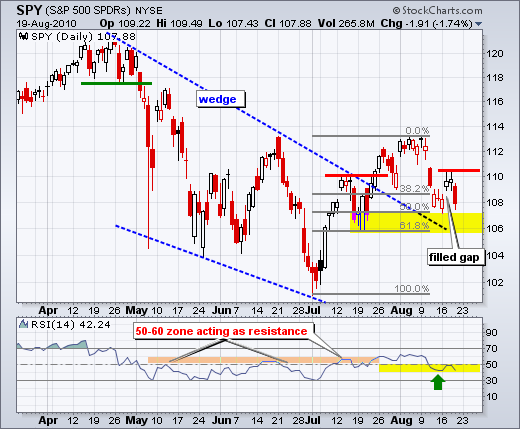
SPY gapped up on Tuesday and then filled that gap with a long red candlestick on Thursday. Some traders apply a three day rule to gaps. A gap that holds three days is valid. One that fails within three days is not. Tuesday's gap has been invalidated... Read More
Art's Charts August 19, 2010 at 06:01 AM
It is one of those times when I can make pretty good arguments for both the bullish and bearish case - short-term and medium-term. This means we could be in for some choppy trading the next few days, weeks or even months... Read More
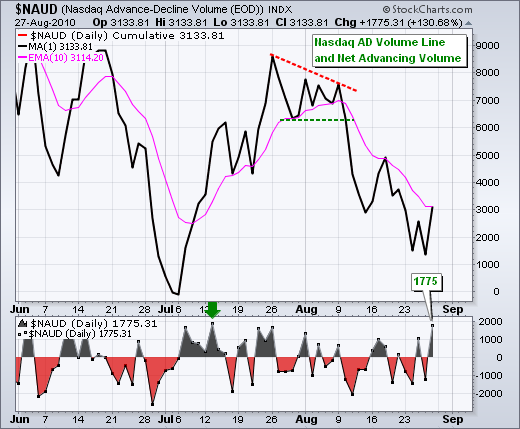
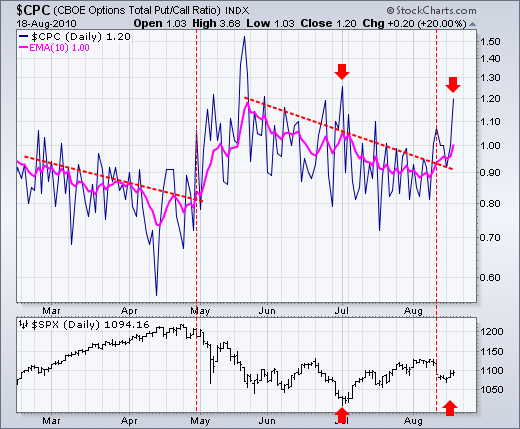
Art's Charts August 18, 2010 at 04:38 AM
Stocks bounced on Tuesday, but I was not impressed with the finish or with breadth. First, let's look at breadth. The charts below show the AD Volume Line and Net Advancing Volume for the NYSE and Nasdaq... Read More
Art's Charts August 17, 2010 at 05:13 AM
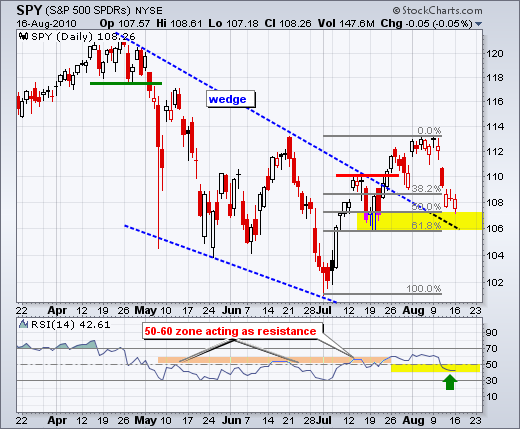
Trend following and mean reversion are two types of trading strategies. Trend followers wait for a reversal and confirmation with a support break or resistance breakout. Mean reversion traders look for overbought or oversold conditions to pick tops or bottoms... Read More
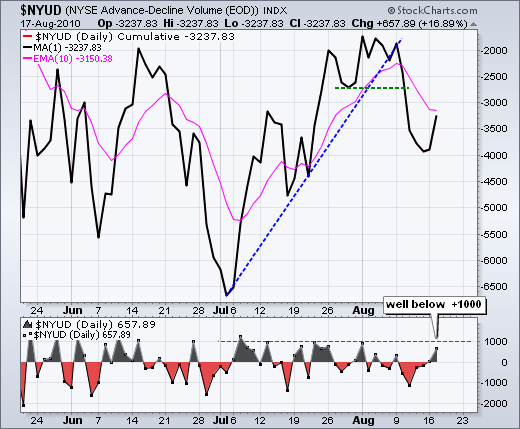
Art's Charts August 16, 2010 at 04:49 AM
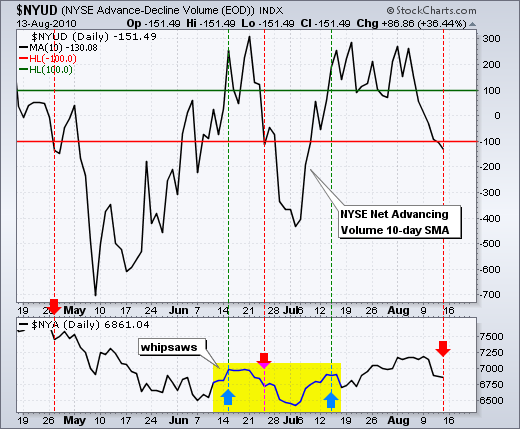
Selling pressure was intense enough to produce a short-term breadth breakdown. The charts below show the 10-day SMA for Net Advancing Volume for the Nasdaq and NYSE. Net Advancing Volume is simply the volume of advancing stocks less the volume of declining stocks... Read More
Art's Charts August 13, 2010 at 05:09 AM
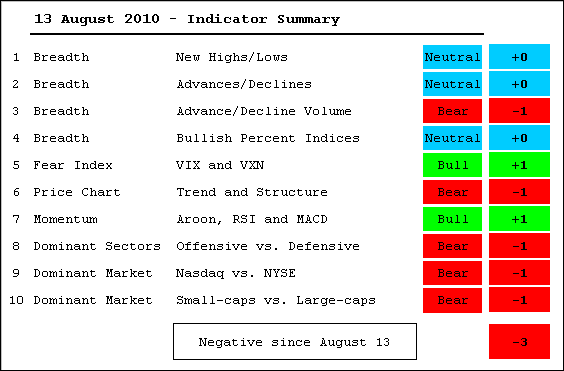
Even though the indicator summary flipped to positive last week, I noted that a sharp decline from current levels could easily flip a few indicators back to the bears. That is indeed what happened... Read More
Art's Charts August 13, 2010 at 03:53 AM

The S&P 500 ETF (SPY) gapped down again on the open, but managed to bounce and close well above its open to form a hollow candlestick. Even so, the ETF closed below its prior close to color the candlestick red. Nevertheless, SPY remains below its support break at 1088... Read More
Art's Charts August 12, 2010 at 05:45 AM
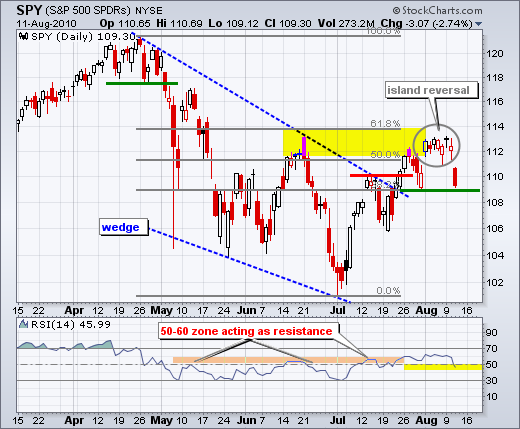
With a gap up, tight consolidation and gap down, the S&P 500 ETF (SPY) formed an island reversal over the last two weeks. It all started with the gap and close above 112 on August 2nd. The ETF traded between 111 and 113 the next six days and then opened below 111 on Wednesday... Read More
Art's Charts August 11, 2010 at 03:56 AM
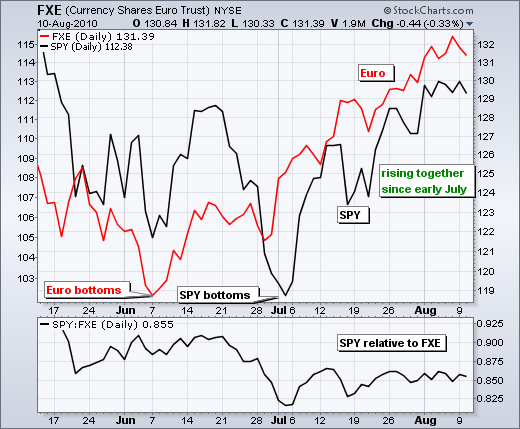
Even though stocks bounced after the Fed announcement, S&P futures are down sharply in pre-market trading today. European and Asian stocks are also lower this morning. The Euro is getting slammed (130.5) and this may signal a return to the risk-off trade... Read More
Art's Charts August 10, 2010 at 05:47 AM
Don't fight the Fed. This Wall Street motto is as old as the Fed. Even if you doubt the Fed's ability to influence the long-term outcome, the Fed can still affect the short-term expectations. Quantitative easing (QE) is back on the table and this may keep a bid in stocks... Read More
Art's Charts August 09, 2010 at 05:46 AM
Despite a worse-than-expected jobs number, stocks managed to limit early losses and surge in the final hour of trading. Conspiracy theorists are calling this manipulation. Maybe. Maybe not. To be honest, nobody really knows... Read More
Art's Charts August 06, 2010 at 05:28 AM
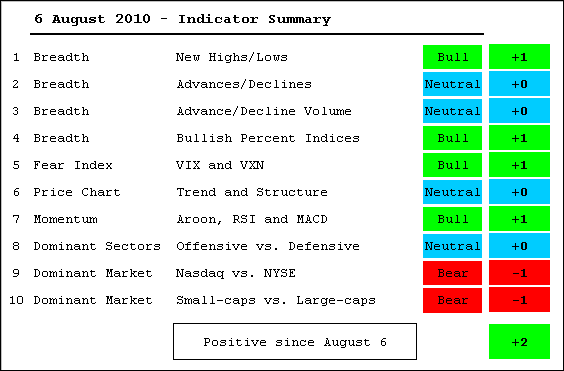
The overall picture is still mixed, but bullish assessments of the volatility indices and Net New Highs pushed the indicator summary into positive territory for the first time since mid June... Read More
Art's Charts August 06, 2010 at 04:20 AM
Despite a jump in initial jobless claims, the market managed to mute its losses and trade in a narrow range. The consensus was for 455,000 initial jobless claims and the actual number was 479,000. This is considerably higher, but the market took it in stride... Read More
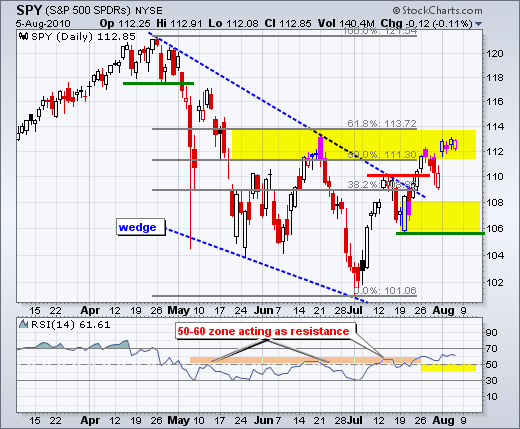
Art's Charts August 05, 2010 at 05:01 AM
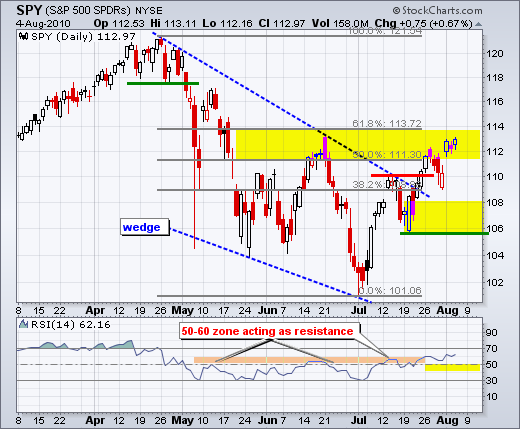
There is no change in the medium-term or short-term trends, which are both up. Even though SPY is trading in a resistance zone marked by the June high and 50-62% retracement zone, the trend is up and we have yet to see a failure or reversal at resistance... Read More
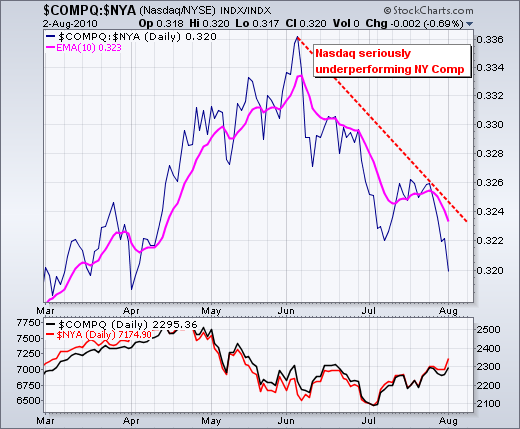
Art's Charts August 04, 2010 at 04:44 AM
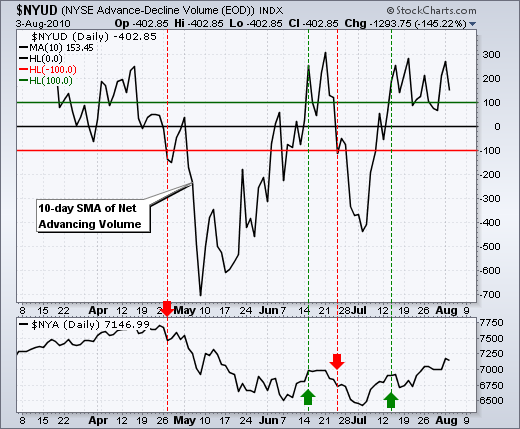
The NYSE and NY Composite have been driving the current rally. NYSE breadth has been stronger than Nasdaq breadth and the NY Composite has far outperformed the Nasdaq over the last five weeks. The leader will offer the first clues of a potential reversal... Read More
Art's Charts August 03, 2010 at 03:57 AM
The bulls came out charging on Monday. Strength in European banks and equities triggered yesterday's strong open. More importantly, stocks remained strong throughout the day and the major index ETFs closed near their highs for the session... Read More
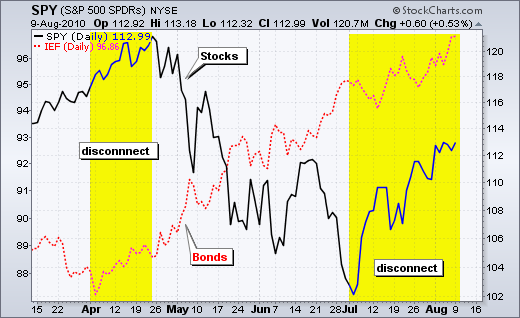
Art's Charts August 02, 2010 at 06:44 AM
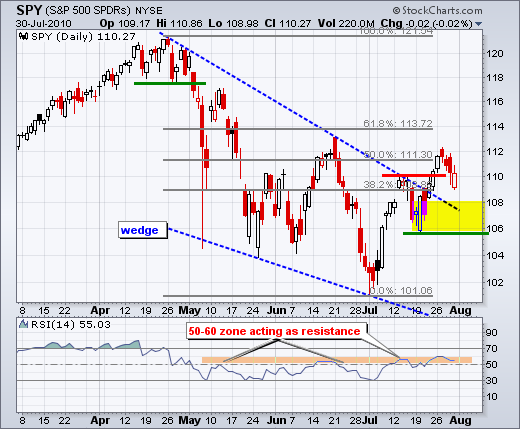
After a big surge in July, the S&P 500 ETF (SPY) hit resistance around 112 and pulled back last week. Overall, SPY broke above the wedge trendline and exceeded its mid July high... Read More