Art's Charts October 31, 2010 at 02:13 AM
First note that I will be travelling on Tuesday and will not be able to write a commentary that day. The next commentary will be Wednesday morning. It is just as well because the markets will digest the week's first big event on Wednesday morning... Read More
Art's Charts October 29, 2010 at 05:19 AM
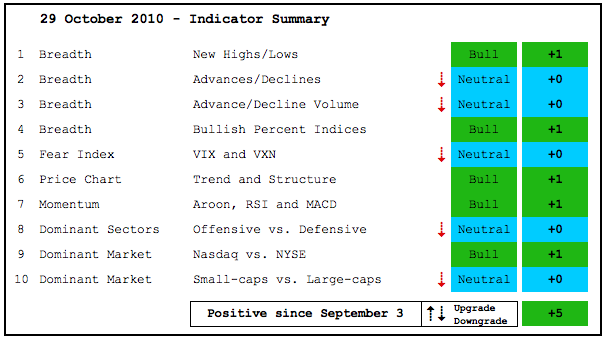
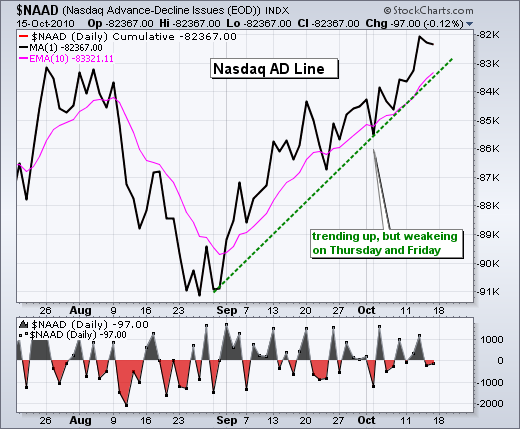
The indicator summary remains bullish overall, but five indicators were downgraded from bullish to neutral. First, the NYSE AD Volume Line peaked in mid October and is starting to lag. Second, the Nasdaq AD Line flattened as the Nasdaq continued higher... Read More
Art's Charts October 29, 2010 at 04:17 AM
There are likely to be some serious fireworks next week. This is one of the biggest news weeks that I can remember. First, we have election results on Tuesday. Second, the Fed meets on Wednesday. Third, there is the employment report on Friday... Read More
Art's Charts October 28, 2010 at 11:35 AM
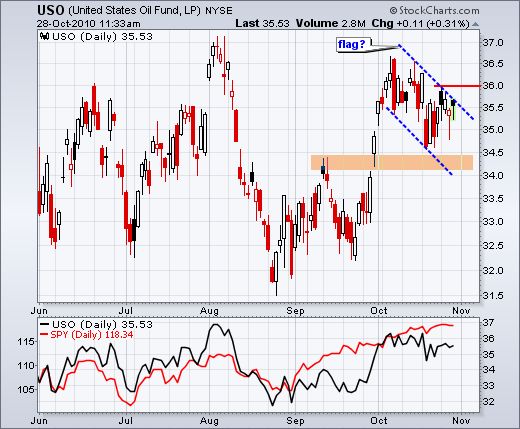
After a breakout and big surge towards the August highs, the USO Oil Fund (USO) took a breather with a pullback over the last few weeks. The falling zigzag in October looks like a falling flag, which is a bullish continuation pattern. The surge from 32.5 to 36... Read More
Art's Charts October 28, 2010 at 03:57 AM
This commentary and charts-of-interest are designed to stimulate thinking. This analysis is not a recommendation to buy, sell, hold or sell short any security (stock ETF or otherwise). We all need to think for ourselves when it comes to trading our own accounts... Read More
Art's Charts October 28, 2010 at 03:53 AM
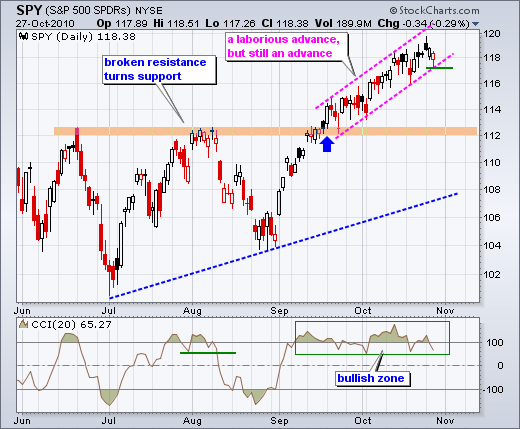
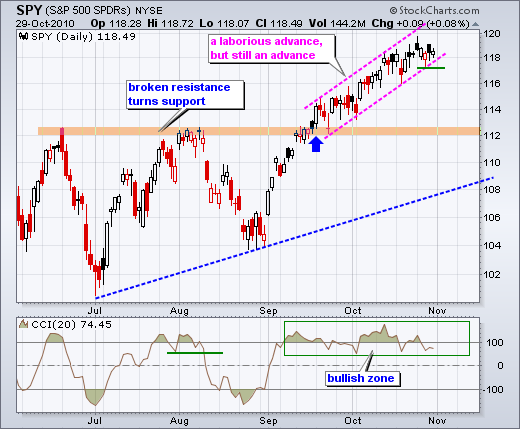
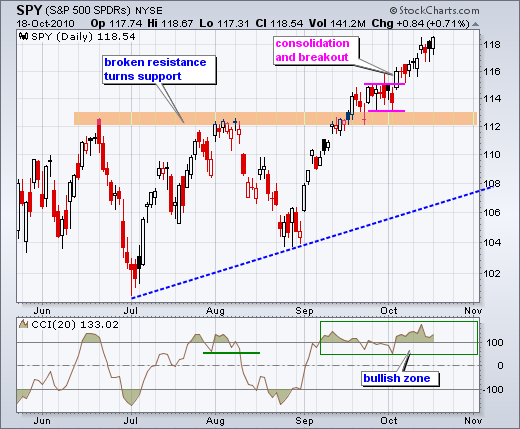
There is no change on the daily chart. Even though the advance has grown laborious, SPY remains in an uptrend. The surge above 114 on September 20th marked the easy part of the advance. Since this surge, SPY has worked its way higher within a rising price channel... Read More
Art's Charts October 27, 2010 at 03:38 AM
There were some serious rumblings in the intermarket arena on Tuesday. Bonds plunged, long-term rates surged, the Euro declined sharply and the Dollar bounced. Forget about the Fed and QE2. These are already priced into the market. Bonds and the Dollar are looking ahead of QE2... Read More
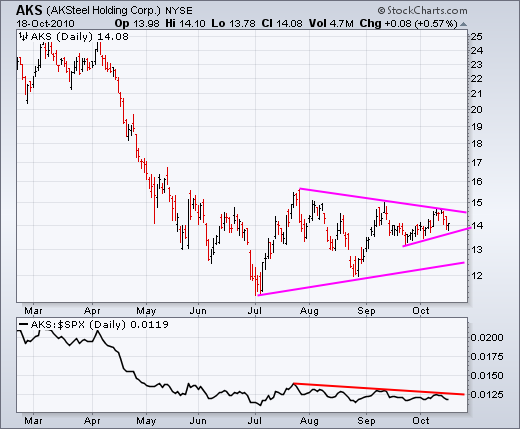
Art's Charts October 26, 2010 at 04:18 AM
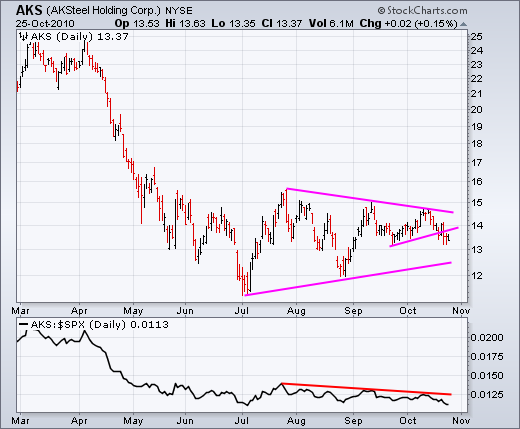
Charts: AKS, ALTR, AMKR, HOLX, HRS, IDCC, MAS, POOL, WHR ----------------------------------------------------------------------------- This commentary and charts-of-interest are designed to stimulate thinking... Read More
Art's Charts October 26, 2010 at 04:11 AM
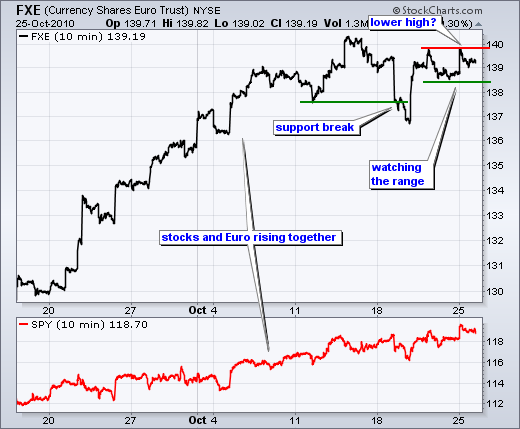
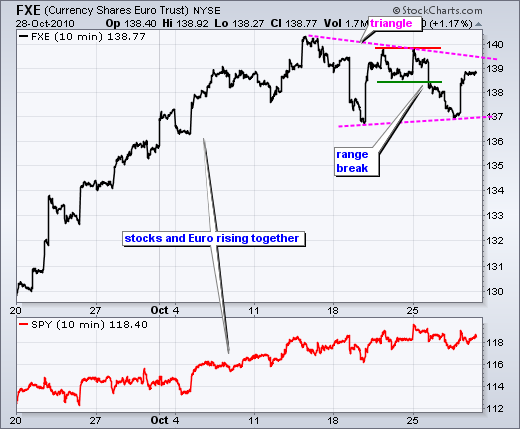
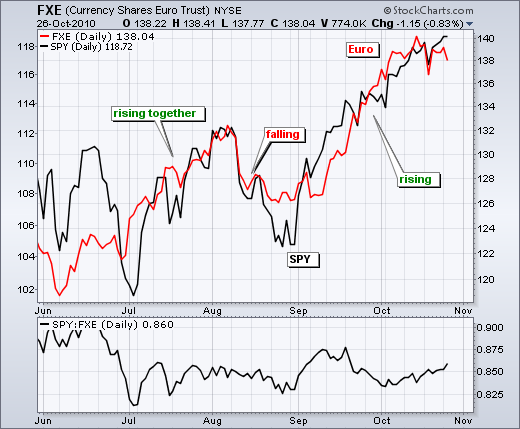
I continue to watch bonds and the Euro for clues on equities. The first chart shows the Euro Currency Trust (FXE) surging on the open, but failing to break last week's high and falling back. It is possible that we have a lower high taking shape after last week's support break... Read More
Art's Charts October 25, 2010 at 06:33 AM
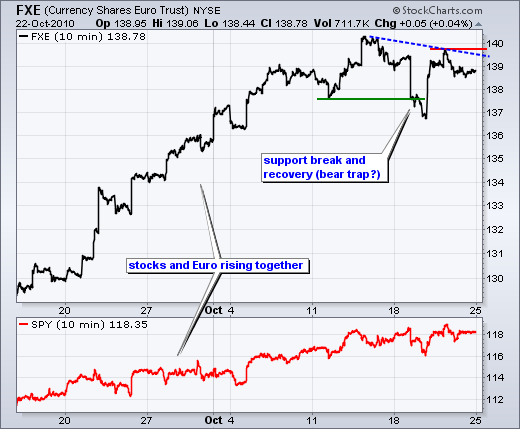
The Euro Currency Trust (FXE) and the S&P 500 ETF (SPY) have been positively correlated throughout 2010. This positive correlation is especially strong since late August. Both are up over 10% since late August... Read More
Art's Charts October 22, 2010 at 03:48 AM
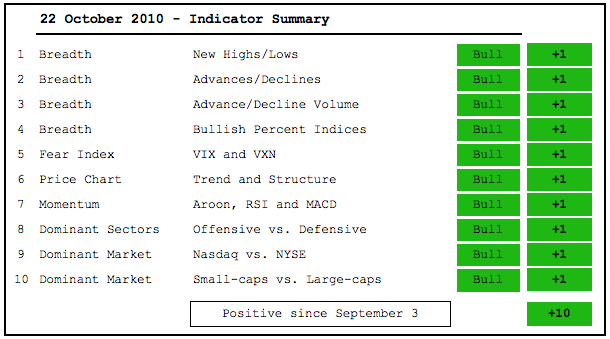
There is no change in the indicator summary, which remains firmly bullish. With all ten indicators in bull mode, it would take a few weeks to turn the tide bearish. I am not predicting this. I am merely reinforcing the lagging nature of this indicator summary... Read More
Art's Charts October 22, 2010 at 03:05 AM
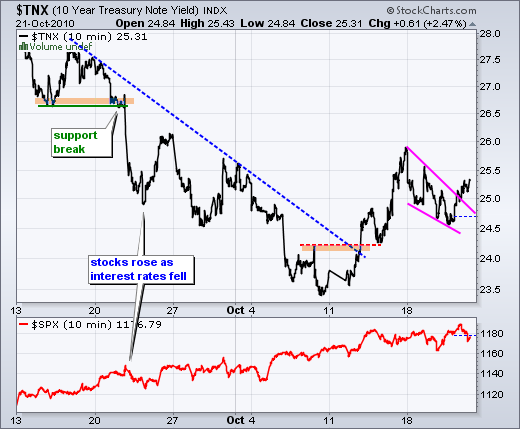
The intermarket picture is getting quite interesting. First, the 10-year Treasury Yield ($TNX) broke wedge resistance to signal a continuation of last week's breakout. A bullish breakout in yields means a bearish breakdown in bonds... Read More
Art's Charts October 21, 2010 at 05:14 AM
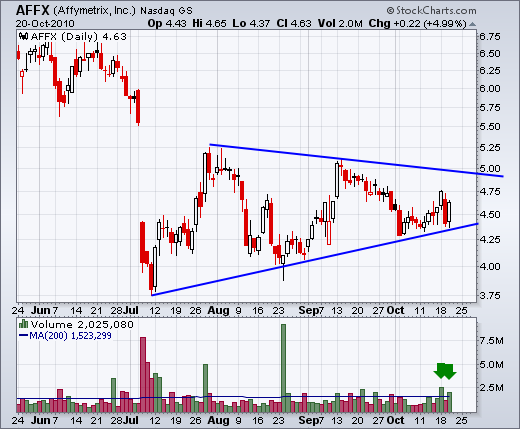
AFFX bounces off support with good volume. ESRX breaks flag resistance. EXP forms long triangle. INTC bounces off support with good volume. PAYX forms bullish consolidation... Read More
Art's Charts October 21, 2010 at 05:09 AM
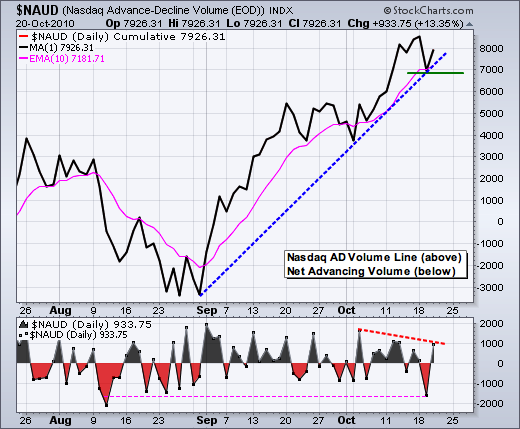
The bulls are clearly not going down without a fight. While yesterday's rebound looked impressive, breadth fell short of the prior highs and the bulls appear to be loosing steam. The first chart shows the Nasdaq AD Volume Line and Net Advancing Volume... Read More
Art's Charts October 20, 2010 at 03:07 AM
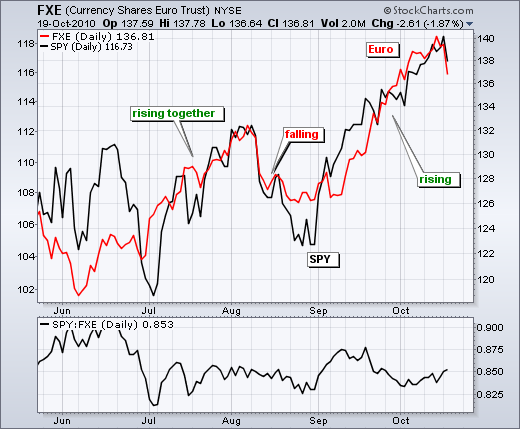
Big moves in the Euro and Apple weighed on stocks Tuesday. Apple declined after its earnings announcement, which was surely a buy-the-rumor sell-the-news event. The Euro Currency Trust (FXE) declined almost 2% after hitting a key retracement level last week... Read More
Art's Charts October 19, 2010 at 04:40 AM
BSX forms tight ascending triangle, MSFT breaks triangle resistance, MDT edges above consolidation resistance, SNDK forms bearish wedge. WY breaks triangle support... Read More
Art's Charts October 19, 2010 at 04:33 AM
Stalling is not the same as weakness. I noted yesterday that SPY gapped up on Wednesday and stalled. Hanging man candlesticks followed on Thursday and Friday as the stall extended... Read More
Art's Charts October 18, 2010 at 03:49 AM
Here's one for the record books. The Nasdaq was up 1.37% and the Nasdaq 100 was up 2.10% on Friday, but Net Advances were a negative 97. Despite big advances, there were more declining stocks on the Nasdaq than advancing stocks... Read More
Art's Charts October 15, 2010 at 07:16 AM
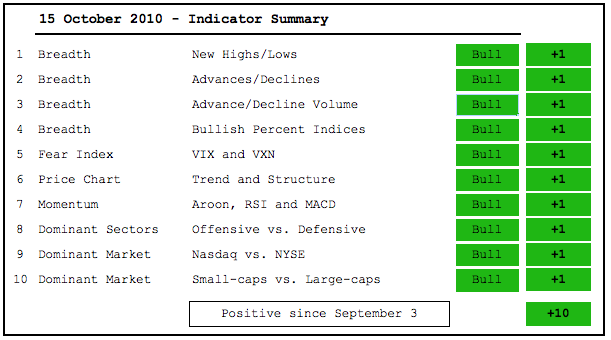
With a breakout in the Nasdaq AD Line, all ten indicators are now in bull mode. This indicator summary has been positive since September 3rd, going on six weeks now. DIA and QQQQ are challenging their April highs, but the Finance SPDR (XLF) remains below its summer highs... Read More
Art's Charts October 15, 2010 at 03:53 AM
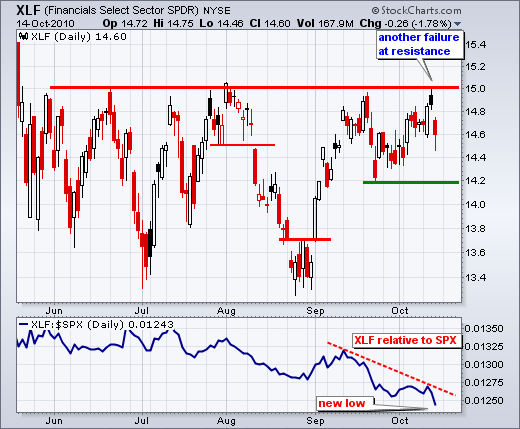
The finance sector remains a thorn in the bull's hoof. Even though majority of the market is in bull mode, the Finance SPDR (XLF) remains a serious laggard... Read More
Art's Charts October 14, 2010 at 06:31 AM
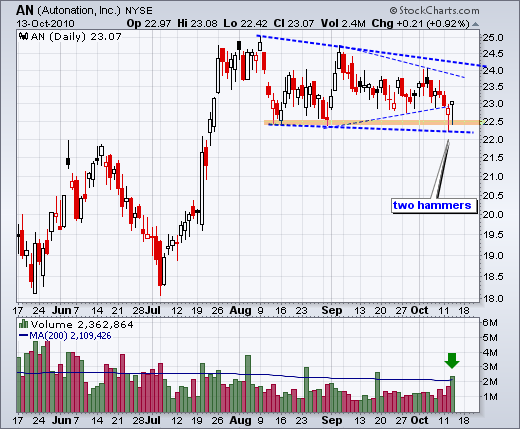
AN forms a high volume hammer. BSX forms small ascending triangle. CAG breaks resistance on good volume. GILD breaks flag resistance. LEAP consolidates after breakout. TIN breaks triangle resistance on big volume. TLAB gaps to triangle resistance... Read More
Art's Charts October 14, 2010 at 06:27 AM
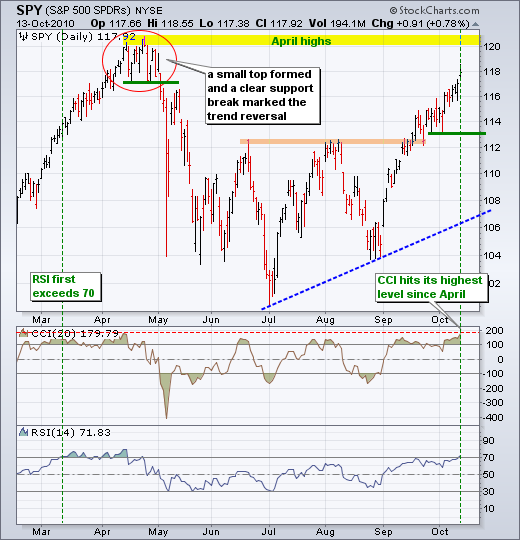
With another surge higher the last four days, the major index ETFs are overbought by most measures. SPY is up over 13% in seven weeks, 14-day RSI moved above 70 and CCI is near 180. RSI was last above 70 in mid April... Read More
Art's Charts October 13, 2010 at 03:35 AM

Maybe it is just coincidence, but there sure is a strong negative correlation between the Dollar and stocks. Stocks started weak as the Dollar surged in early trading. The FOMC minutes hit the market in the afternoon and the Dollar swooned as QE2 became more of a reality... Read More
Art's Charts October 12, 2010 at 10:21 AM
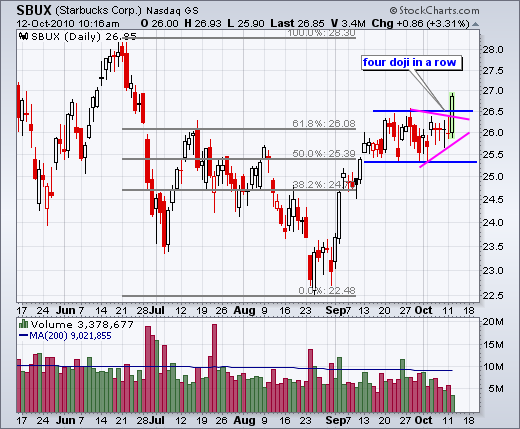
After consolidating near a key retracement and forming four doji, Starbucks (SBUX) broke through pennant resistance with a surge early Tuesday. The June highs mark the next resistance level. A move below Tuesday's low would signal a breakout failure... Read More
Art's Charts October 12, 2010 at 05:04 AM
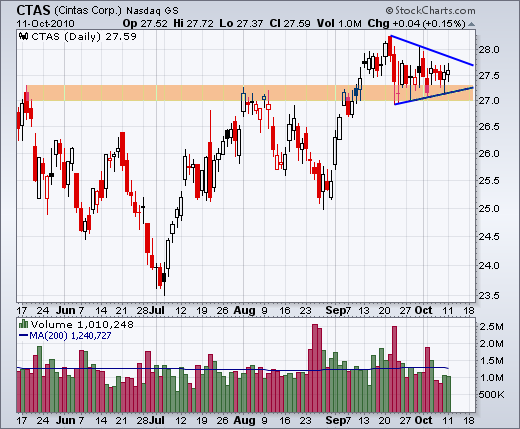
CTAS shows 3 weeks of relative weakness. EBAY breaks flag support. EXPD forms rising flag on lower volume. PFCB consolidates after long red candlestick. RIMM retraces 50% rising wedge. SBUX stalls at key retracement with four doji... Read More
Art's Charts October 12, 2010 at 04:57 AM
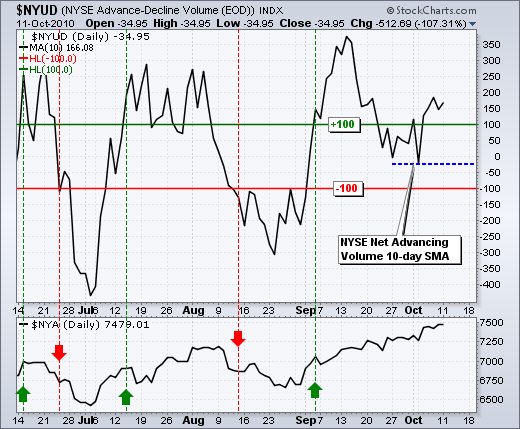
A review of my short-term indicators confirms short-term uptrend, but there are some signs that the advancing is tiring. In particular, the 10-day SMA for Net Advancing Volume shows some weakness over the last two weeks... Read More
Art's Charts October 11, 2010 at 07:12 AM
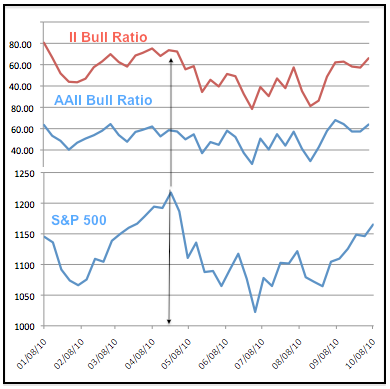
Survey data is often used to measure extremes in bullish sentiment or bearish sentiment. It is bearish when too many respondents are bullish and bullish when too many are bearish. These surveys spend most of their time between bullish and bearish extremes (i.e. without signals)... Read More
Art's Charts October 08, 2010 at 11:51 AM
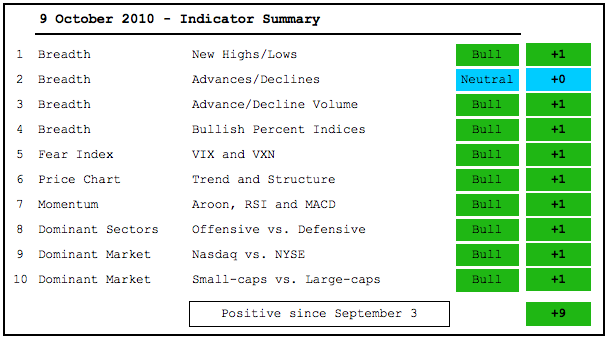
The indicator summary remains positive, but there are a couple of concerns. First, relative weakness in the finance cast a cloud over the current advance. Second, the Nasdaq has been underperforming the NY Composite the last two weeks. This may be just a pullback... Read More
Art's Charts October 07, 2010 at 06:09 AM
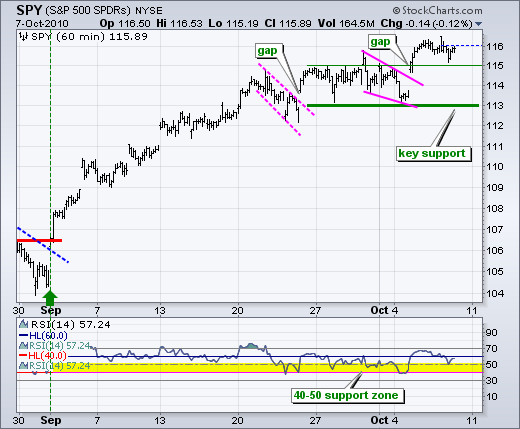
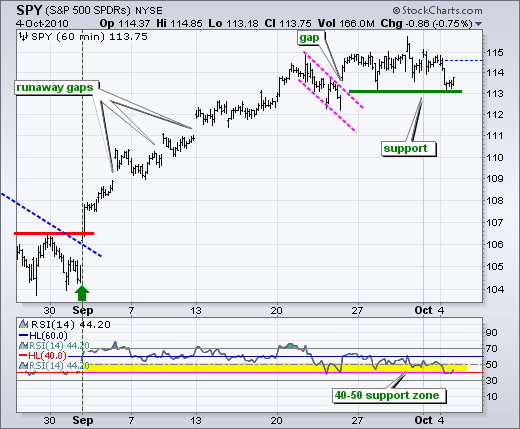
There is no change on the daily chart so I will go directly to the 60-minute chart. Whether or not SPY holds its breakout depends on the market's reaction to the employment report. The news is not what is important here. It is the market's reaction to the news... Read More
Art's Charts October 06, 2010 at 10:02 AM
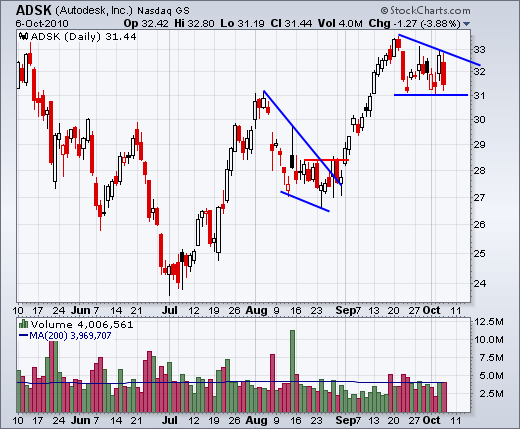
ADSK forms small descending triangle. ARO breaks out on good volume. AN tests support, DDS underperforms within consolidation. ETR shows weakness with expanding volume. GILD forms bull flag near resistance... Read More
Art's Charts October 06, 2010 at 09:57 AM
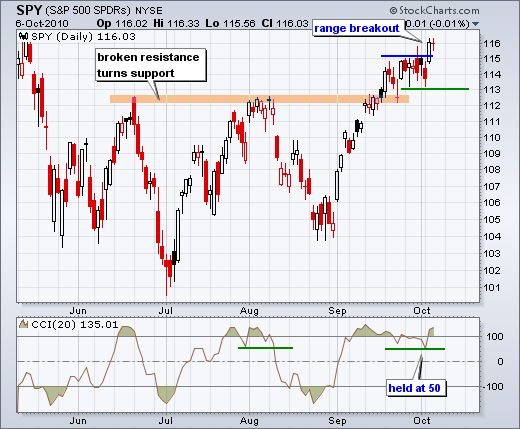
On the daily chart, SPY broke above range resistance with a gap and long white candlestick on Tuesday. These developments affirmed the medium-term uptrend and reinforced short-term support around 113. The bulls are on firm footing as long as this breakout holds... Read More
Art's Charts October 05, 2010 at 09:14 AM
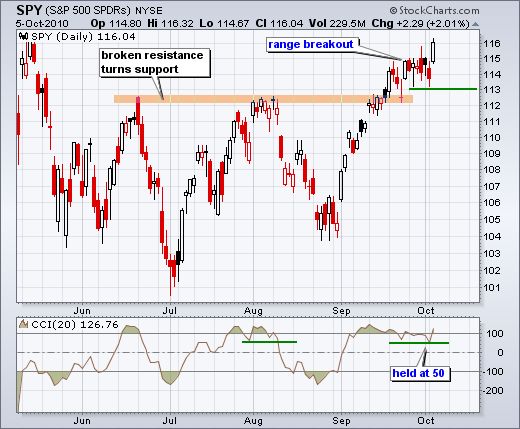
On the daily chart, the S&P 500 ETF (SPY) broke above range resistance with a gap and long white candlestick on Tuesday. This move clearly keeps the uptrend alive. SPY broke above its summer highs in late September and this breakout held... Read More
Art's Charts October 05, 2010 at 01:59 AM
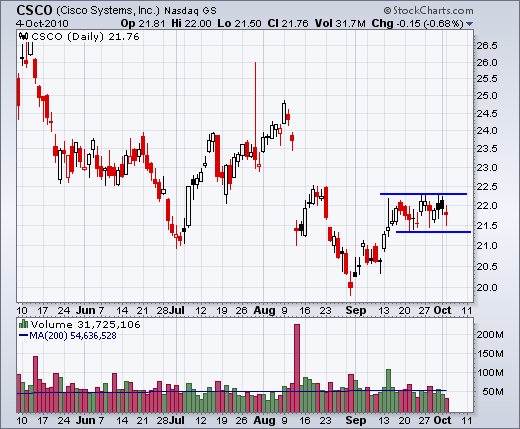
Charts of Interest: CSCO, DDS, ERTS, FITB, MI, STT ----------------------------------------------------------------------------- This commentary and charts-of-interest are designed to stimulate thinking... Read More
Art's Charts October 05, 2010 at 01:52 AM
There is no change in the daily chart analysis. An ABC correction could be taking shape, but there is no confirmation because the short-term trend remains up. A short-term trend reversal is needed for the earliest possible indication that a bigger decline is starting... Read More
Art's Charts October 03, 2010 at 02:26 AM
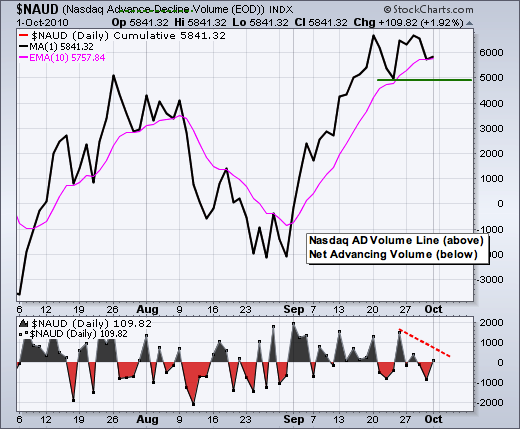
The NYSE AD Volume Line moved to a new high last week, but the Nasdaq AD Volume Line failed to exceed its prior high and traded flat. We also saw a little relative weakness in the Nasdaq and techs relative to the broader market last week... Read More
Art's Charts October 01, 2010 at 12:50 PM
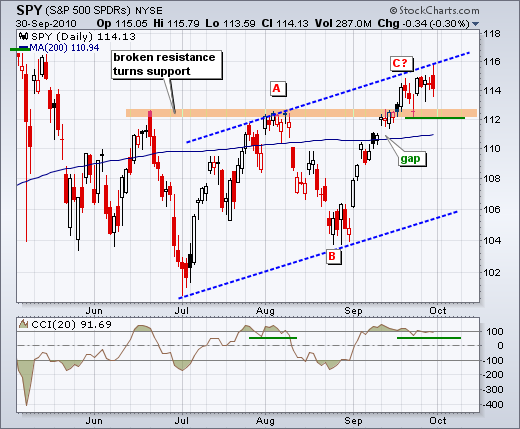
There is still no change on the daily chart. SPY continues to stall around 114-115 and has yet to break support. Even though the trend is clearly up here, I am leaving the ABC correction possibility on the chart. SPY is also near channel resistance and overbought... Read More
Art's Charts October 01, 2010 at 11:46 AM
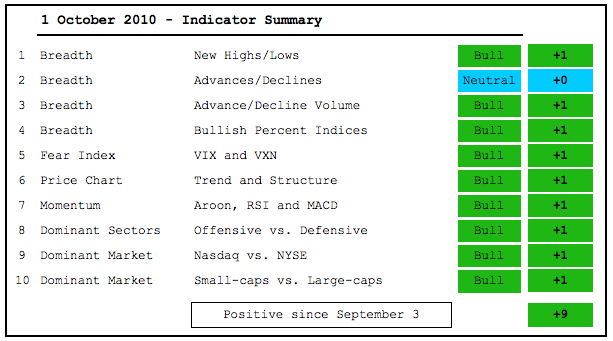
The indicator summary has been positive for almost a full month. While there are no signs of medium-term weakness, there are some signs of short-term fatigue setting into the market. First, the Russell 2000 ETF is still battling resistance from its summer highs... Read More