Art's Charts November 30, 2010 at 06:18 AM
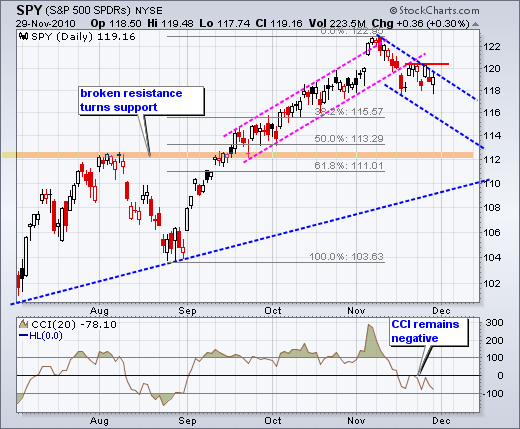
On the daily chart, SPY broke channel support with a gap down in mid November and this break is holding. This short-term support break started a short-term downtrend that is considered a correction within the bigger uptrend... Read More
Art's Charts November 30, 2010 at 06:16 AM
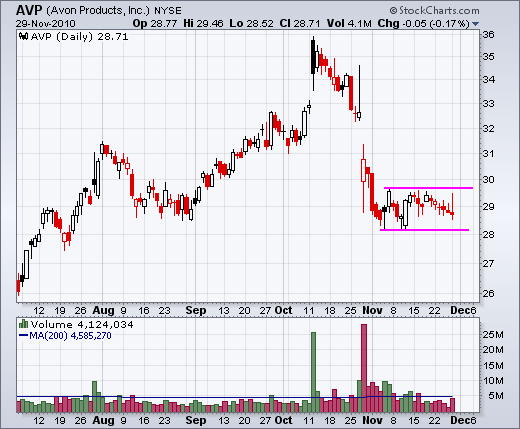
AVP consolidates after sharp decline. BBY gaps down. FAST breaks triangle resistance. Plus BXP, ITW, SPG, WM, X ----------------------------------------------------------------------------- This commentary and charts-of-interest are designed to stimulate thinking... Read More
Art's Charts November 29, 2010 at 06:05 AM
The S&P 500 ETF (SPY) remains in a short-term downtrend that is viewed as a correction within a bigger uptrend. Defining the length and the duration of this correction is an imprecise science. We can, however, set precise resistance levels to define the downtrend... Read More
Art's Charts November 26, 2010 at 04:03 AM
It is a strange situation. The anecdotal evidence favors the bears, but the stock market price action remains strong. The 10-year Treasury Yield ($TNX) surged back above 2.9% on Friday and the Euro/Dollar fell below 1.33... Read More
Art's Charts November 24, 2010 at 03:18 AM
The bulk of the short-term evidence is bearish, but the medium-term evidence remains bullish. This means short-term weakness is viewed as a correction within a bigger uptrend. Keep in mind that this bigger uptrend holds the trump cards and these can be played at any time... Read More
Art's Charts November 23, 2010 at 04:40 AM
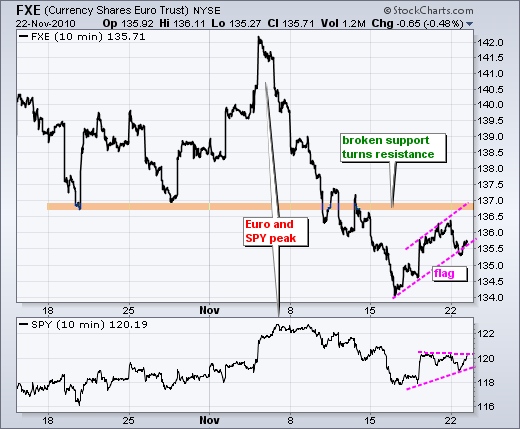
Despite the Irish bank bailout, the Euro declined on Monday and was down in overnight trading on Tuesday. Stocks and the Euro have been positively correlated since April as the Euro pretty much defines the risk on-off trade... Read More
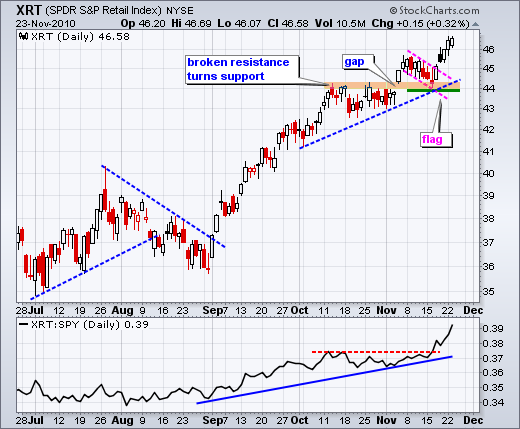
Art's Charts November 23, 2010 at 04:37 AM
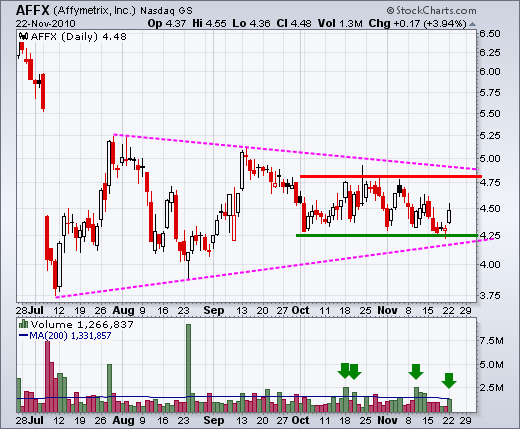
AMAT forms falling flag. MDT firms at key retracement. MSFT finds support near broken resistance. Plus AFFX, CL, MMM, PPDI. ----------------------------------------------------------------------------- This commentary and charts-of-interest are designed to stimulate thinking... Read More
Art's Charts November 22, 2010 at 10:55 AM
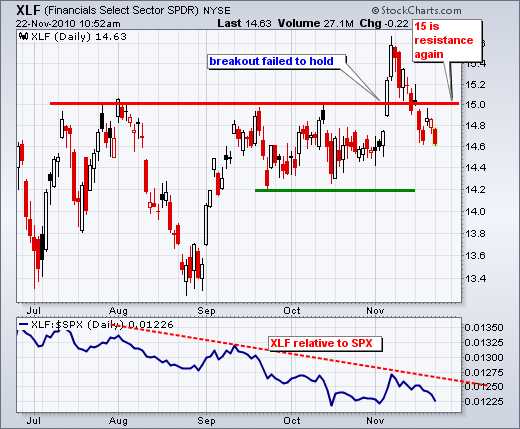
The Finance SPDR (XLF) is leading the market lower on Monday as European debt concerns weigh. XLF broke resistance at 15 in early November, but failed to hold this breakout with a move back below 15. After a feeble bounce last week, 15 has become resistance once gain... Read More
Art's Charts November 22, 2010 at 03:39 AM
Ireland accepted an aid package and the Euro is getting a bounce this morning. It is not a huge bounce though. Euro strength could give US equities a lift as we head into Thanksgiving. It is a shortened week with three full trading days (Mon-Tue-Wed) and a short day on Friday... Read More
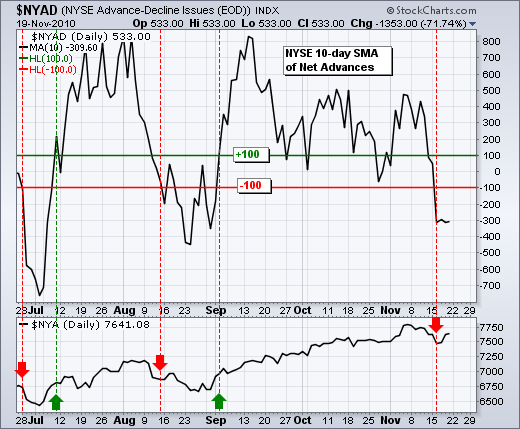
Art's Charts November 19, 2010 at 04:59 AM
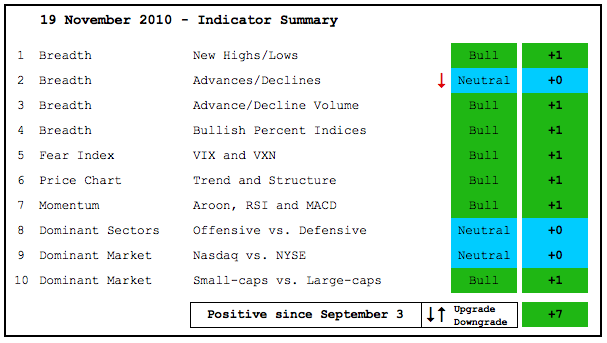
Even with a rather sharp setback the last two weeks, the indicator summary remains positive. Some indicators were on a verge of a change, but Thursday's rebound in the stock market kept them in bull mode... Read More
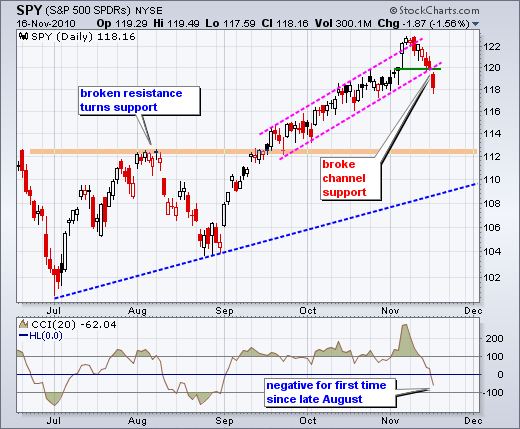
Art's Charts November 19, 2010 at 04:04 AM
The Euro got an oversold bounce and bonds moved lower. Stocks also got an oversold bounce, but did not do much after the opening gap. SPY broke channel support with a gap down and long red candlestick on Tuesday... Read More
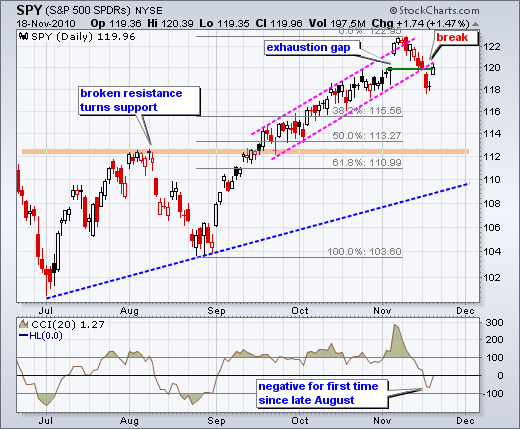
Art's Charts November 18, 2010 at 04:55 AM
Before hitting the charts, note that EU and IMF officials flew into Dublin (Ireland) today in an effort to convince Irish officials to accept a bailout. The Euro is quite oversold after a sharp decline from 142 to 134 (4... Read More
Art's Charts November 18, 2010 at 04:53 AM
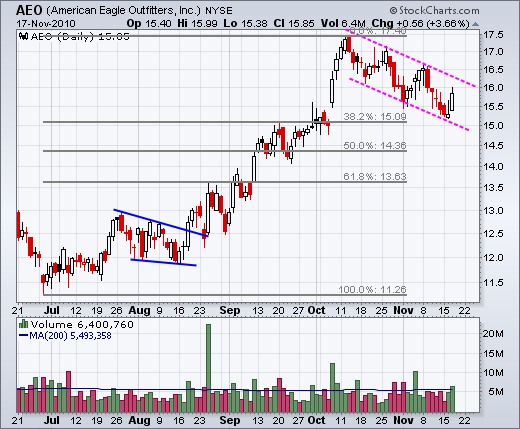
AEO Forms Falling Flag. CHS Gaps above Triangle Resistance. MMM Firms at Key Retracement. Plus CX, EK, SEE ----------------------------------------------------------------------------- This commentary and charts-of-interest are designed to stimulate thinking... Read More
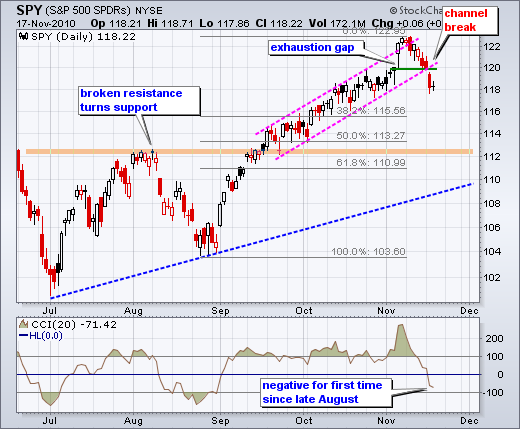
Art's Charts November 17, 2010 at 03:55 AM
With a sharp decline on Tuesday, the bulk of the short-term evidence has turned bearish. First, three of the four short-term breadth indicators moved into bear mode. These were featured in Monday's commentary... Read More
Art's Charts November 16, 2010 at 06:58 AM
The Euro and US Treasuries were hit again on Monday, but both are getting short-term oversold and ripe for a bounce. Even an oversold bounce in these two could provide a boost for stocks... Read More
Art's Charts November 16, 2010 at 06:56 AM
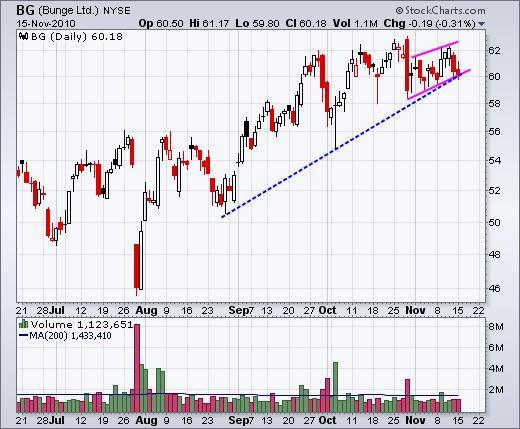
$HD and $LOW Show Relative Weakness. $DTV Forms Bear Flag. $NUE Fails at Resistance. Plus $BG and $MOT This commentary and charts-of-interest are designed to stimulate thinking... Read More
Art's Charts November 15, 2010 at 10:18 AM
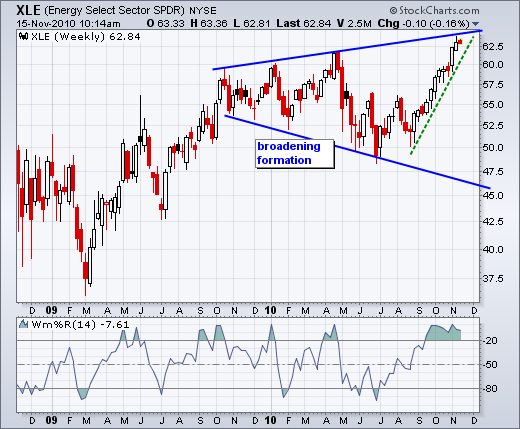
With a 10+ percent advance the last 11-12 weeks, the Energy SPDR (XLE) is trading near the upper trendline of a broadening formation. The swing within this formation is up as XLE remains above the green trendline and Williams %R remains in overbought territory... Read More
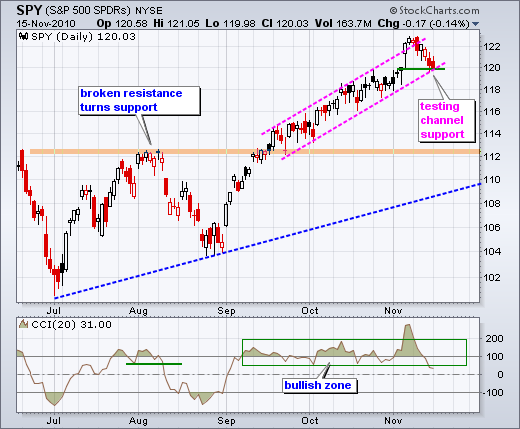
Art's Charts November 15, 2010 at 05:08 AM
The Euro and US Treasuries are moving lower, which means the Dollar and US interest rates are moving higher. With these negatives weighing on the stock market, SPY declined around 2% last week. This was the biggest weekly decline since early August... Read More
Art's Charts November 15, 2010 at 05:06 AM
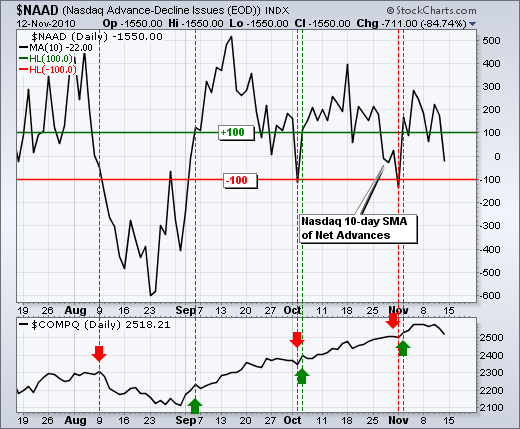
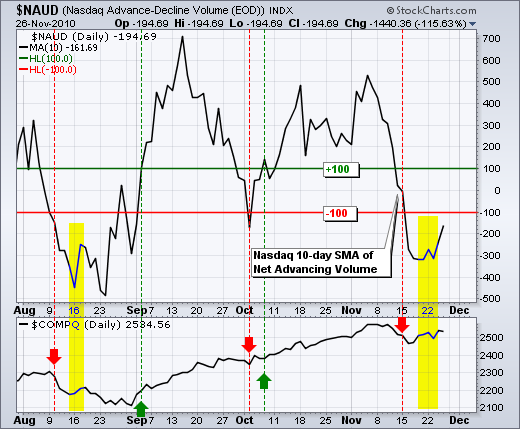
Breadth took a hit last week, but my short-term breadth indicators have yet to turn bearish. The next four charts show the 10-day SMA for Net Advances and Net Advancing Volume for the Nasdaq and NYSE. These indicators oscillate above/below the zero line... Read More
Art's Charts November 12, 2010 at 11:36 AM
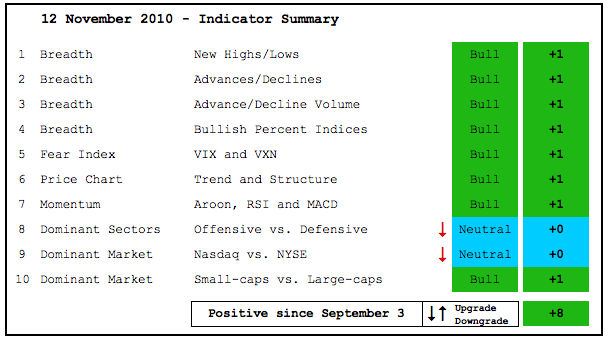
The indicator summary remains firmly positive, but weakness in the technology and industrials sectors caused me to downgrade two of the ten indicators. These downgrades were simply from bullish to neutral. A few days of weakness is not enough to change the overall picture... Read More
Art's Charts November 11, 2010 at 06:08 AM
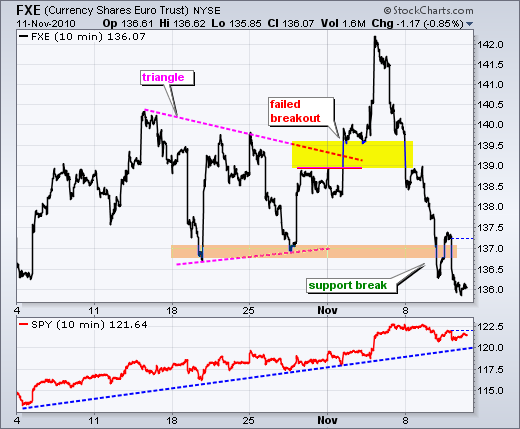
After breaking triangle resistance at the beginning of November, the Euro Currency Trust (FXE) gave it all back and broke support from the late October lows. This reversal of fortune is quite amazing... Read More
Art's Charts November 10, 2010 at 09:42 AM
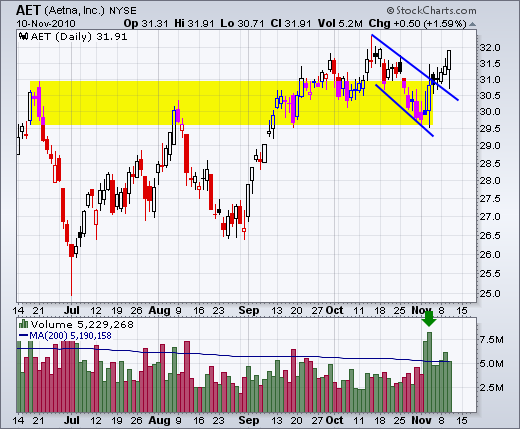
Charts: AET, AFFX, DELL, HD, PDCO, PRU ----------------------------------------------------------------------------- This commentary and charts-of-interest are designed to stimulate thinking... Read More
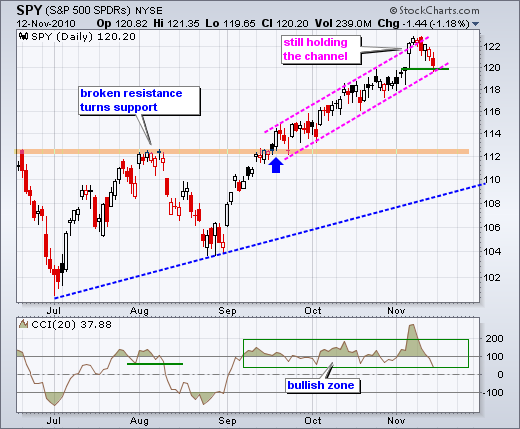
Art's Charts November 10, 2010 at 09:35 AM
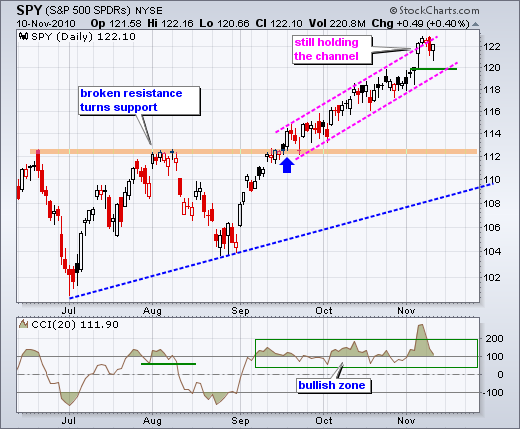
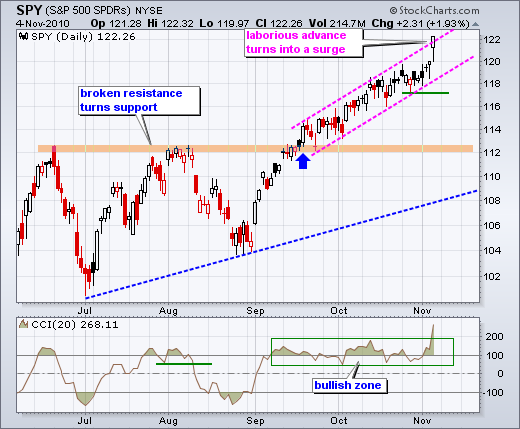
SPY remains in an uptrend on the daily chart with a rising price channel over the last eight weeks. After surging above 122 last Thursday and then stalling for two days, the ETF formed a bearish engulfing pattern on Tuesday... Read More
Art's Charts November 09, 2010 at 04:27 AM
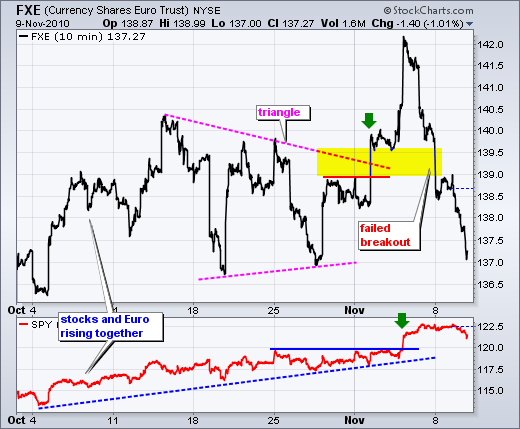
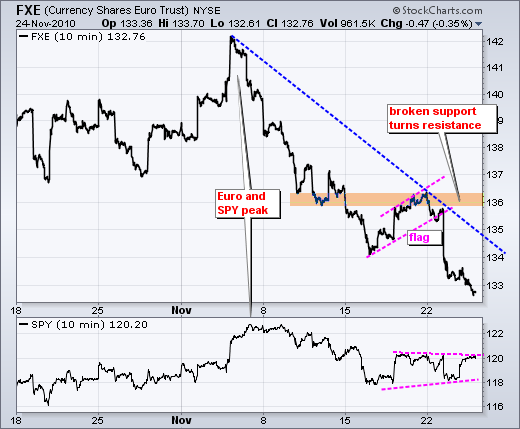
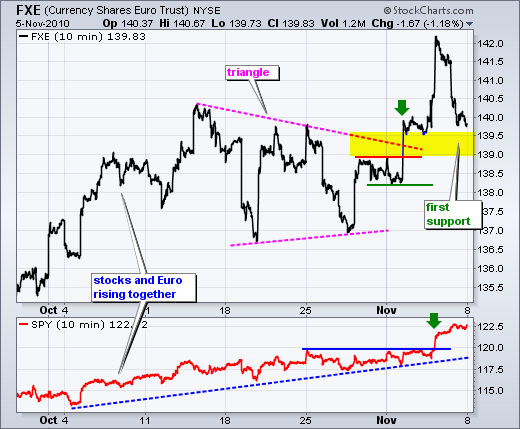
It is always difficult to pick the exact cause of an advance or decline in stocks, but the positive correlation between the Euro and stocks has been quite strong this year. The Euro Currency Trust (FXE) extended its three day slide with a move below 137.5 on Tuesday... Read More
Art's Charts November 09, 2010 at 04:21 AM
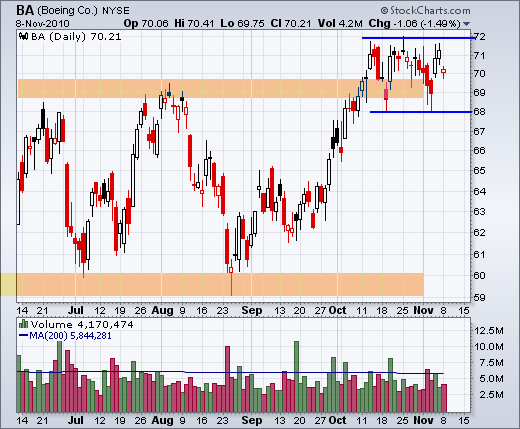
BA consolidates above breakout. BG forms pennant after engulfing. HOLX traces out a triangle. CTXS stalls near key retracement. ERTS surges off support with good volume. GCI gaps off support with good volume. MON forms harami cross at resistance... Read More
Art's Charts November 08, 2010 at 04:17 AM
With the Euro taking a big hit on Friday-Monday, bullish resolve in the stock market will be tested right off the bat this week. The Dollar strengthened for three reasons... Read More
Art's Charts November 05, 2010 at 05:40 AM
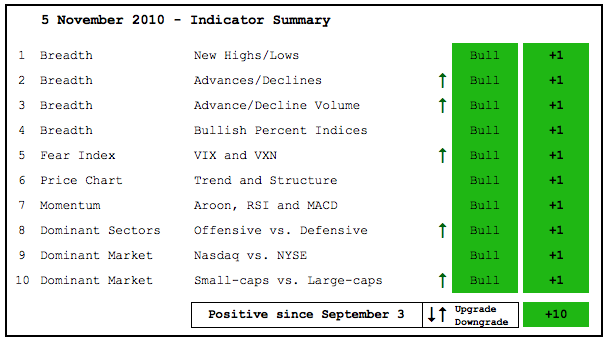
That certainly did not take long. Five indicators were downgraded from bullish to neutral last Friday. These indicators did not break down to warrant a bearish stance, but I downgraded them to neutral because they were not confirming the new highs seen in the major indices... Read More
Art's Charts November 05, 2010 at 04:35 AM
Stocks started the week strong and surged on Thursday with big gains in all major indices. All sectors were up with materials, energy, and finance leading the charge. These three were up over 3%. It is positive to see relative strength coming from the finance sector... Read More
Art's Charts November 04, 2010 at 05:35 AM
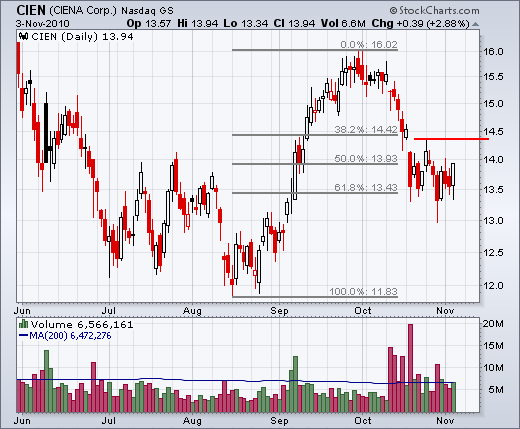
$CIEN firms at key retracement. $CVS forms bull flag. $FITB shows relative strength. $GPS, $HD, $QLGC and $WFC. ----------------------------------------------------------------------------- This commentary and charts-of-interest are designed to stimulate thinking... Read More
Art's Charts November 04, 2010 at 05:32 AM
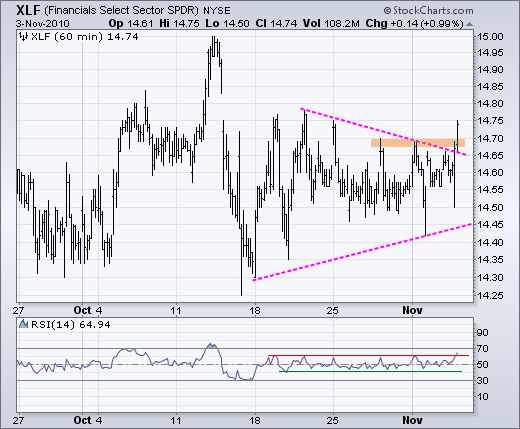
Two down, one to go. The elections and the Fed have passed with little fanfare for stocks. Details of QE2 were released in the Fed policy statement. Bonds went one way and the Finance SPDR (XLF) went the other way. Funny how that worked... Read More
Art's Charts November 03, 2010 at 05:04 AM
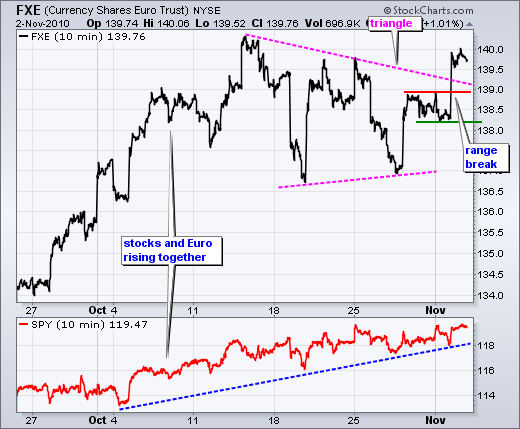
The Euro broke resistance as long-term rates fell back to support. The first chart shows the Euro Currency Trust (FXE) breaking above range resistance and moving above the triangle trendline. This bullish development for the Euro is a positive for stocks... Read More