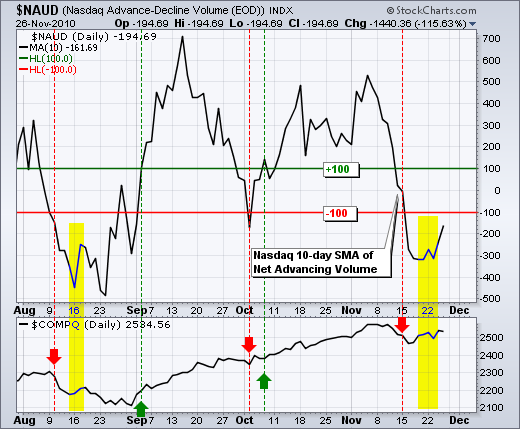
The S&P 500 ETF (SPY) remains in a short-term downtrend that is viewed as a correction within a bigger uptrend. Defining the length and the duration of this correction is an imprecise science. We can, however, set precise resistance levels to define the downtrend. This means the downtrend will remain in force until proven otherwise. There are three things to watch. First, last week's highs mark SPY resistance in the 120-120.5 area. Second, RSI is hitting resistance in the 50-60 zone on the 60-minute chart and CCI is hitting resistance at zero on the daily chart. Look for both to break resistance to turn momentum bullish. Third, key breadth indicators remain in bear mode after plunging below -100 in mid November.


Why use +100 for the bullish threshold and -100 for the bearish threshold? This is simply as a buffer. Using crosses above/below the zero line for bullish/bearish signals produces too many whipsaws (short signals). Setting a buffer just above/below zero reduces the number of signals. Moreover, setting a higher or lower threshold requires some strength or weakness to register before accepting a signal. Notice how the 10-day SMA for NYSE Net Advancing Volume moved below zero in late October, but did not break below -100 for a bearish signal. Users are invited to experiment with these parameters.
On the daily chart, SPY broke channel support with a gap down in mid November and this break is holding. The ETF tried to break back above 120.5 twice in the last two weeks, but failed to affirm short-term resistance here. As far as downside targets, we can draw a falling price channel and extend the lower trendline. Also note the 38% retracement around 115.57. Notice that CCI continues to hit resistance at zero.

On the 60-minute chart, SPY formed a triangle over the last two weeks. There have been five gaps in the last eight days, which is testament to the bull-bear tug-o-war currently underway. Even though IWM and QQQQ broke resistance, SPY failed because it was weighed down by relative weakness in the finance sector. A break below triangle support (118) would signal a continuation lower and project further weakness towards 115-116. Notice that RSI continues to hit resistance in the 50-60 zone.

Key Economic Reports:
Tue - Nov 30 - 09:00 - Case-Shiller 20-city Index
Tue - Nov 30 - 09:45 - Chicago PMI
Tue - Nov 30 - 10:00 - Consumer Confidence
Tue - Nov 30 – 20:00 – Bernanke Speaks
Wed - Dec 01 - 07:00 - MBA Mortgage Applications
Wed - Dec 01 - 10:00 - ISM Index
Wed - Dec 01 - 10:00 - Construction Spending
Wed - Dec 01 - 10:30 - Crude Inventories
Wed - Dec 01 - 14:00 - Auto/Truck Sales
Wed - Dec 01 - 14:00 - Beige Book
Thu - Dec 02 - 08:30 - Jobless Claims
Thu – Dec 02 - 10:00 - Pending Home Sales
Fri – Dec 03 - 08:30 - Employment Report
Fri - Dec 03 - 10:00 - Factory Orders
Fri - Dec 03 - 10:00 - ISM Services
Charts: Tuesday and Thursday in separate post.
-----------------------------------------------------------------------------
This commentary and charts-of-interest are designed to stimulate thinking. This analysis is not a recommendation to buy, sell, hold or sell short any security (stock ETF or otherwise). We all need to think for ourselves when it comes to trading our own accounts. First, it is the only way to really learn. Second, we are the only ones responsible for our decisions. Think of these charts as food for further analysis. Before making a trade, it is important to have a plan. Plan the trade and trade the plan. Among other things, this includes setting a trigger level, a target area and a stop-loss level. It is also important to plan for three possible price movements: advance, decline or sideways. Have a plan for all three scenarios BEFORE making the trade. Consider possible holding times. And finally, look at overall market conditions and sector/industry performance.
