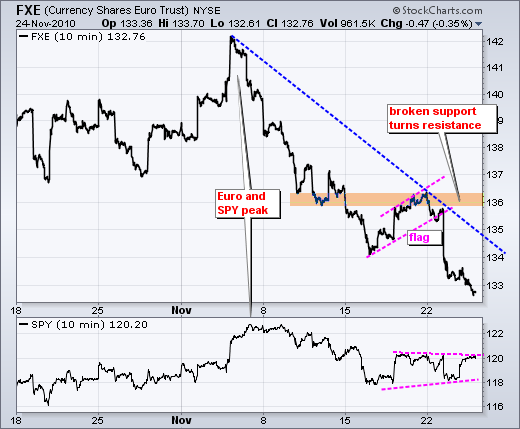
It is a strange situation. The anecdotal evidence favors the bears, but the stock market price action remains strong. The 10-year Treasury Yield ($TNX) surged back above 2.9% on Friday and the Euro/Dollar fell below 1.33. Rising yields and a weak Euro would normally be bearish for stocks, but seasonality and the medium-term uptrend pulled rank on Wednesday. First, stocks are in the bullish six-month period. Second, as noted on Monday, the Wednesday before Thanksgiving and the Friday after have a bullish bias.
Now what? Small-caps and techs led Wednesday's big move was, but the S&P 500 ETF (SPY) continues to lag. This means we have a non-confirmation of sorts working. In other words, the bulls are not firing on all cylinders. IWM and QQQQ both held last week's gaps-breakouts and moved above short-term resistance. These two clearly broke resistance and are in short-term uptrends. Even though relative strength in small-caps and techs is positive overall, the short-term breadth indicators remain in bear mode. As the charts below show, the 10-day SMAs for Nasdaq Net Advancing Volume and NYSE Net Advances remain well below +100. Bearish signals were triggered with the moves below -100 and will not be reversed until we see a move back above +100. There were upward spikes after the mid August bearish signals and Wednesday's spike could be the same.


On the daily chart, SPY gapped up and closed strong to form a long white candlestick, but did not break above the highs of the last five days. This area marked resistance late last week and a break is needed to fully reverse the short-term downtrend. CCI also remains below zero to keep momentum with a bearish bias.

On the 60-minute chart, SPY has now produced sizable gaps four of the last seven trading days. Despite these gaps, the ETF remains range bound with support around 117.5-118 and resistance around 120-120.50. I marked key resistance at 120 on Wednesday, but I should have taken the prior highs into consideration and marked a resistance zone in the 120-120.5 area. A break above this zone would put SPY on a bullish footing. Right now, the bears still have the short-term edge. There was an important support break in mid November and we have yet to see an important resistance break. RSI also has yet to break above resistance at 60.

Key Economic Reports:
Fri – Nov 26 – 09:00 – Market Closes at 1PM ET
Charts: Tuesday and Thursday in separate post.
-----------------------------------------------------------------------------
This commentary and charts-of-interest are designed to stimulate thinking. This analysis is not a recommendation to buy, sell, hold or sell short any security (stock ETF or otherwise). We all need to think for ourselves when it comes to trading our own accounts. First, it is the only way to really learn. Second, we are the only ones responsible for our decisions. Think of these charts as food for further analysis. Before making a trade, it is important to have a plan. Plan the trade and trade the plan. Among other things, this includes setting a trigger level, a target area and a stop-loss level. It is also important to plan for three possible price movements: advance, decline or sideways. Have a plan for all three scenarios BEFORE making the trade. Consider possible holding times. And finally, look at overall market conditions and sector/industry performance.

About the author:
Arthur Hill, CMT, is the Chief Technical Strategist at TrendInvestorPro.com. Focusing predominantly on US equities and ETFs, his systematic approach of identifying trend, finding signals within the trend, and setting key price levels has made him an esteemed market technician. Arthur has written articles for numerous financial publications including Barrons and Stocks & Commodities Magazine. In addition to his Chartered Market Technician (CMT) designation, he holds an MBA from the Cass Business School at City University in London.
Learn More
