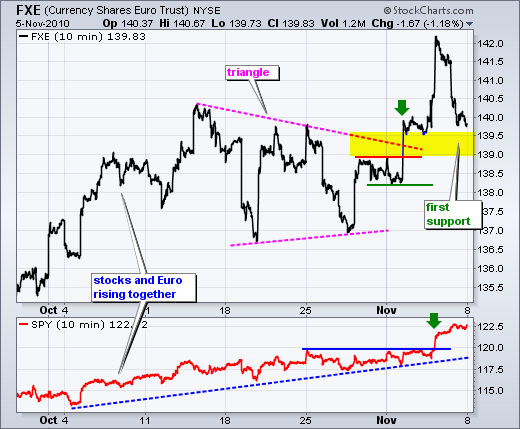
With the Euro taking a big hit on Friday-Monday, bullish resolve in the stock market will be tested right off the bat this week. The Dollar strengthened for three reasons. First, the employment report showed strong job creation, which is positive for the economy and puts upward pressure on interest rates. Second, European debt woes in Ireland and Greece are returning to the surface. Third, the greenback was oversold and ripe for a bounce. The Euro Currency Trust (FXE) is nearing support from broken resistance around 139-139.5. This is the first test. Notice on the chart how FXE broke resistance two days before stocks surged (green arrows). I will continue watching this relationship closely as long as the positive correlation between the Euro and stocks remains.
On the daily chart, SPY surged above the upper trendline of a rising price channel on Thursday and held its gains on Friday. The move above this trendline creates an overbought situation, as does the CCI surge to 277. Even though overbought conditions are a sign of medium-term strength, they can foreshadow a consolidation or pullback over the short-term. Last week's lows and the lower trendline combine to mark a support zone around 118-119.

As noted on Friday, the 60-minute chart shows a slightly different channel. Technical analysis is a little "art" and a little "science". These slightly different channels convey the same message. SPY is short-term overbought and ripe for a pullback or consolidation. I will leave key support at 118 for now. The 60-minute chart also shows a potentially higher support zone around 119-120. This zone stems from broken resistance and the early October trendline.

Key Economic Reports:
Nov 10 - 07:00 - MBA Mortgage Applications
Nov 10 - 08:30 - Jobless Claims
Nov 10 - 10:30 - Oil Inventories
Nov 12 - 09:55 - Michigan Sentiment
Charts: Tuesday and Thursday in separate post.
-----------------------------------------------------------------------------
This commentary and charts-of-interest are designed to stimulate thinking. This analysis is not a recommendation to buy, sell, hold or sell short any security (stock ETF or otherwise). We all need to think for ourselves when it comes to trading our own accounts. First, it is the only way to really learn. Second, we are the only ones responsible for our decisions. Think of these charts as food for further analysis. Before making a trade, it is important to have a plan. Plan the trade and trade the plan. Among other things, this includes setting a trigger level, a target area and a stop-loss level. It is also important to plan for three possible price movements: advance, decline or sideways. Have a plan for all three scenarios BEFORE making the trade. Consider possible holding times. And finally, look at overall market conditions and sector/industry performance.

