Art's Charts April 29, 2011 at 05:58 AM
Even though the finance sector remains a laggard, newfound relative strength in technology is picking up the slack. Led by semis, the Nasdaq and the Technology ETF (XLK) surged almost 5% the last seven trading days... Read More
Art's Charts April 29, 2011 at 04:53 AM
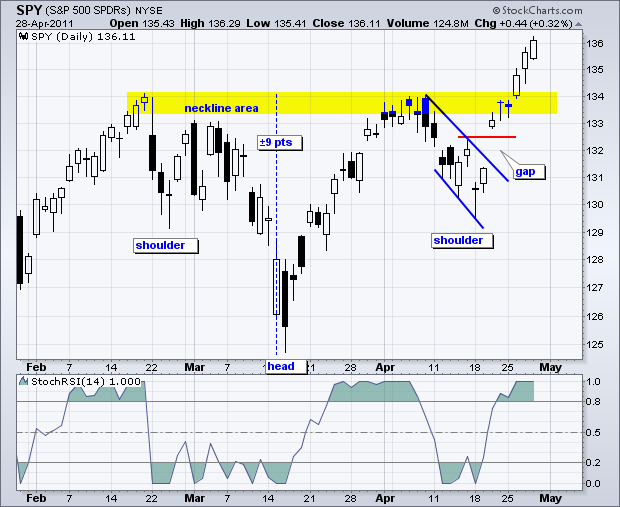
There is no change on the daily chart or 60-minute chart as SPY extends after its breakouts. Broken neckline resistance becomes the first support level to watch on the daily chart... Read More
Art's Charts April 28, 2011 at 10:04 AM
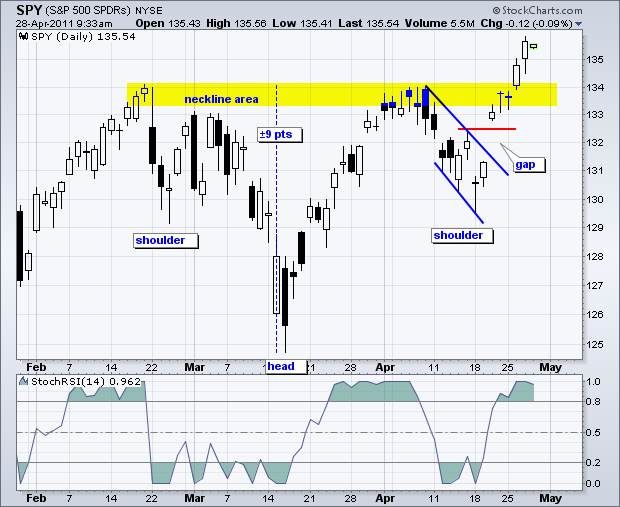
There is no change on the daily chart. The S&P 500 ETF (SPY) broke above neckline resistance that extends from late February to early April. This is another 52-week high that simply re-affirms the long-term uptrend. Traditionally, broken resistance turns into support... Read More
Art's Charts April 28, 2011 at 10:01 AM
ASEI Hits Broken Resistance with Wedge. GCI Surges on Big Volume and then Consolidates. PNRA Declines on High Volume... Read More
Art's Charts April 27, 2011 at 03:09 AM
Please note that Thursday's commentary will be posted a little later in the morning (between 9 and 10AM ET). With a strong open and strong close, the S&P 500 ETF (SPY) broke above neckline resistance that extends from late February to early April... Read More
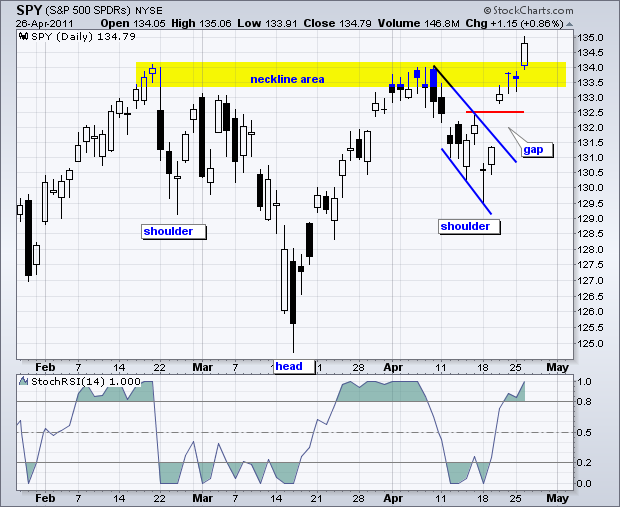
Art's Charts April 26, 2011 at 04:05 AM
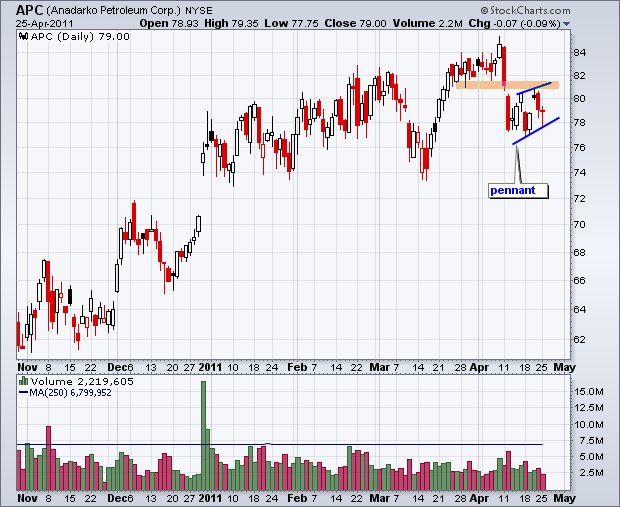
ARO Forms Dark Cloud at Resistance. GE Form Huge Bearish Engulfing. JPM Consolidates at Key Support. Plus APC,IMN,LMT,MSFT,RSH and UIS... Read More
Art's Charts April 26, 2011 at 03:13 AM
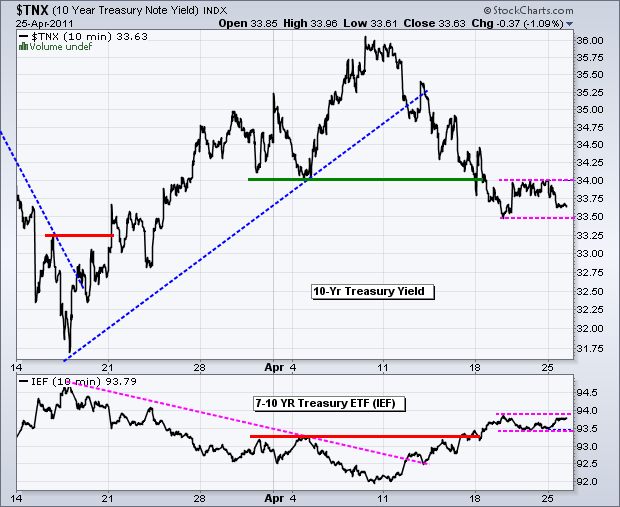
It could be a big week for bonds. The Fed meets this week with a policy statement scheduled at 12:30PM ET. This is earlier than normal because Bernanke is holding a press conference later in the afternoon. Jeeze, like we don't have enough excitement already... Read More
Art's Charts April 25, 2011 at 03:01 AM
On the daily chart, the S&P 500 ETF (SPY) is tracing out a clear inverse head-and-shoulders pattern over the last 2-3 months. The shoulders feature equal lows around 129.5 and the highs in the 133-134 area mark neckline resistance... Read More
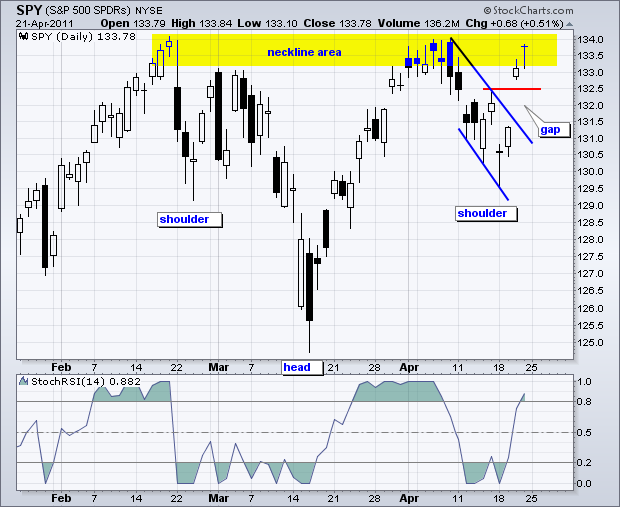
Art's Charts April 21, 2011 at 04:25 AM
The short-term trend is now up with a flag breakout and big gap. On the daily chart, an inverse head-and-shoulders is taking shape now that the right shoulder low has formed a reaction low near the left shoulder low... Read More
Art's Charts April 21, 2011 at 04:22 AM
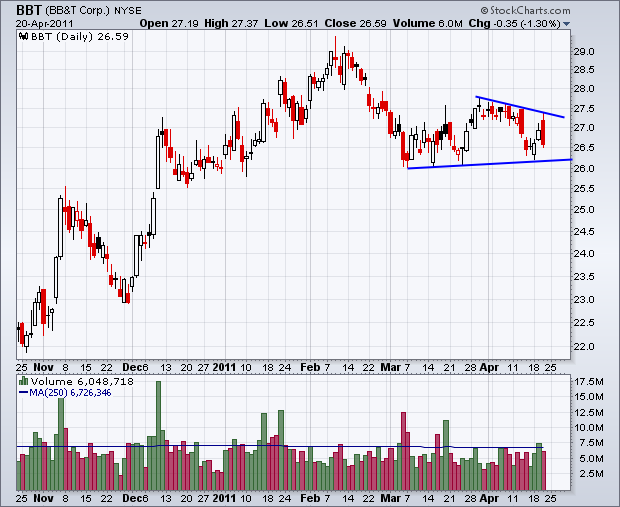
JNPR Surges off Retracement Zone. MBI Forges a Bear Trap. XRX Breaks Flag Resistance. Plus BBT, DF, ILMN, MBI, STT, TXN ----------------------------------------------------------------------------- This commentary and charts-of-interest are designed to stimulate thinking... Read More
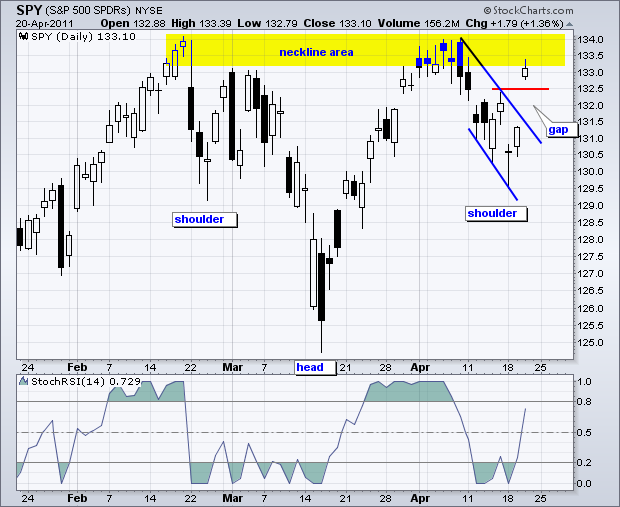
Art's Charts April 20, 2011 at 04:04 AM
The bulls simply refuse to buckle. Despite a gap down on Monday and sharp decline Monday morning, stocks rebounded on Monday afternoon and continued strong on Tuesday. The ability to immediately recover should serve notice to the bears... Read More
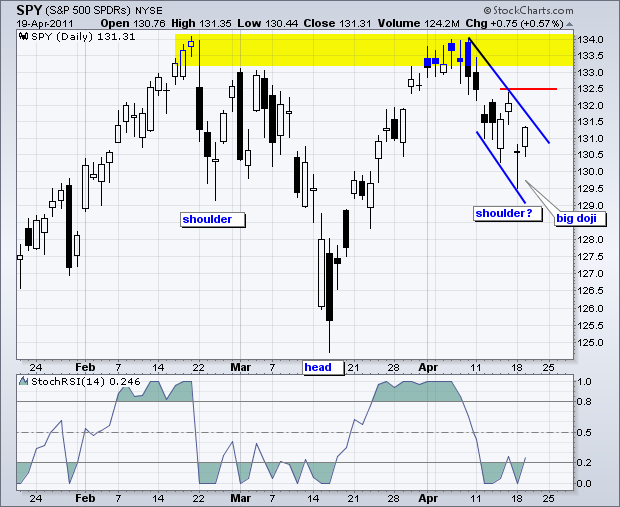
Art's Charts April 19, 2011 at 05:11 AM
Before diving headfirst into some Elliott wave counts, please note that the overall trends take precedent. The overall trend on the daily chart (medium-term) remains up and the overall trend on the 60-minute chart (short-term) remains down... Read More
Art's Charts April 19, 2011 at 05:05 AM
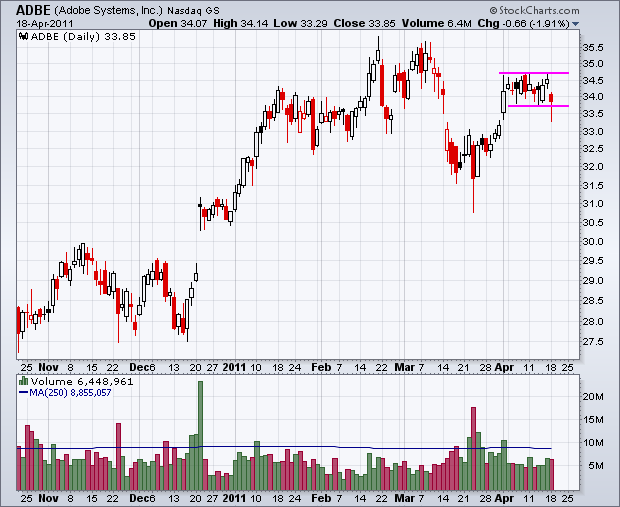
ADBE Maintains Tight Consolidation. AXP Challenges Resistance. PNRA Forms Bear Flag. Plus CRM,DHI,GERN and SHLD. ----------------------------------------------------------------------------- This commentary and charts-of-interest are designed to stimulate thinking... Read More
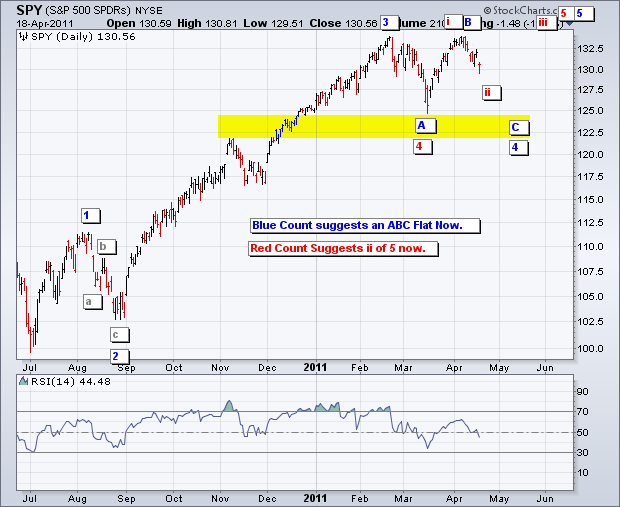
Art's Charts April 18, 2011 at 05:16 AM
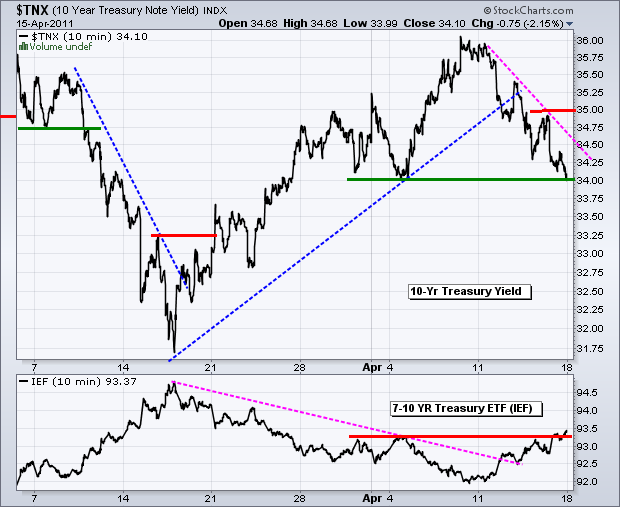
There are a few negatives working against the stock market right now. First, bonds have been rising and yields falling - even though inflationary pressures appear to be building... Read More
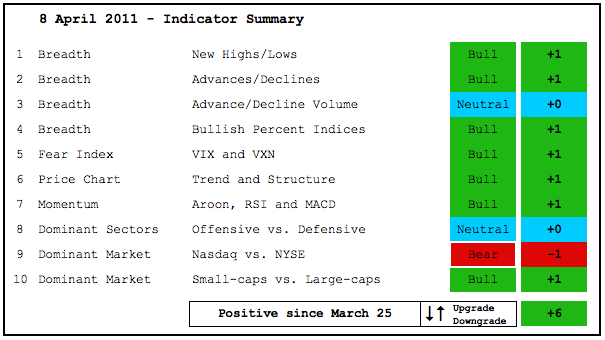
Art's Charts April 15, 2011 at 04:51 AM
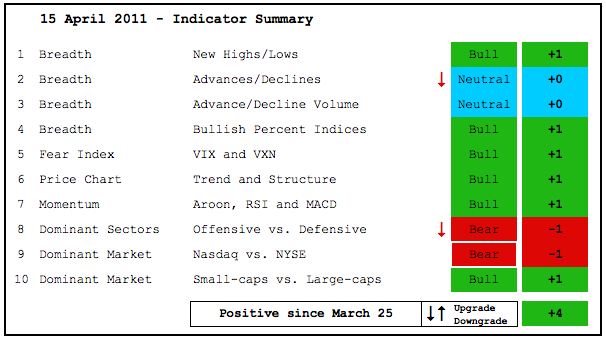
The indicator summary is weighed down by relative weakness in the Nasdaq and some key sectors. First, the Nasdaq has been underperforming the NY Composite since early January. Second, the Nasdaq AD Line and AD Volume Line are weaker than the NYSE AD Line and AD Volume Line... Read More
Art's Charts April 15, 2011 at 03:35 AM
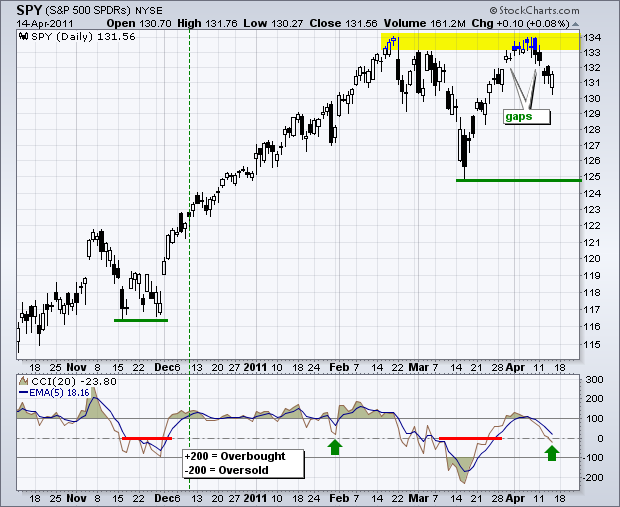
SPY managed to open weak and close strong, but has yet to fill Tuesday's gap and reverse the short-term downtrend. For now, the island reversal remains in play and has yet to be proven otherwise. CCI continues to drift lower and has yet to turn up... Read More
Art's Charts April 14, 2011 at 05:04 AM
The big trend on the daily chart is up as prices move from the lower left to the upper right. SPY became overbought after a big surge back to the February high and backed off this level the last four days... Read More
Art's Charts April 14, 2011 at 05:02 AM
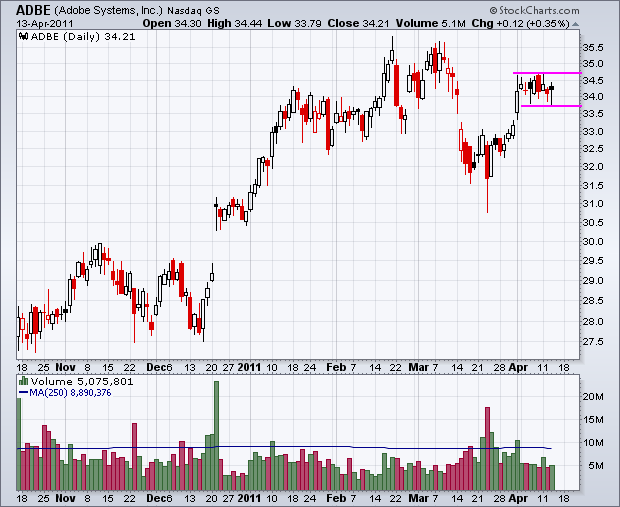
ADBE Forms Tight Consolidation. DOX Breaks Wedge Resistance with Volume. PAYX Stalls Near Retracement Resistance... Read More
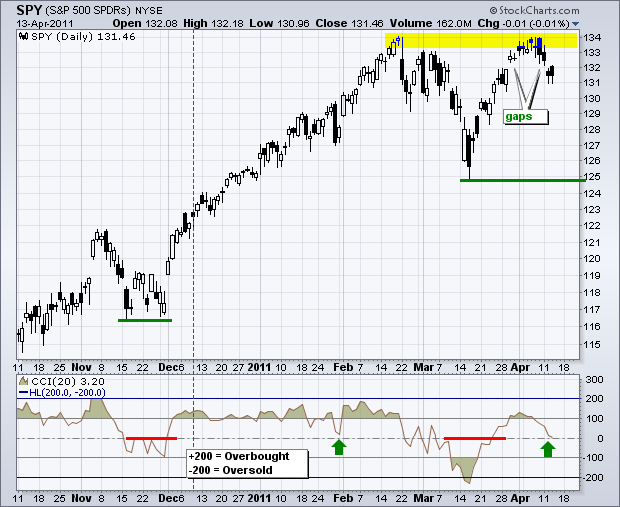
Art's Charts April 13, 2011 at 04:44 AM
On the daily chart, SPY gapped above 132 on March 30th and gapped below this level on April 12th. Technically, an island reversal formed because the gaps match around 132... Read More
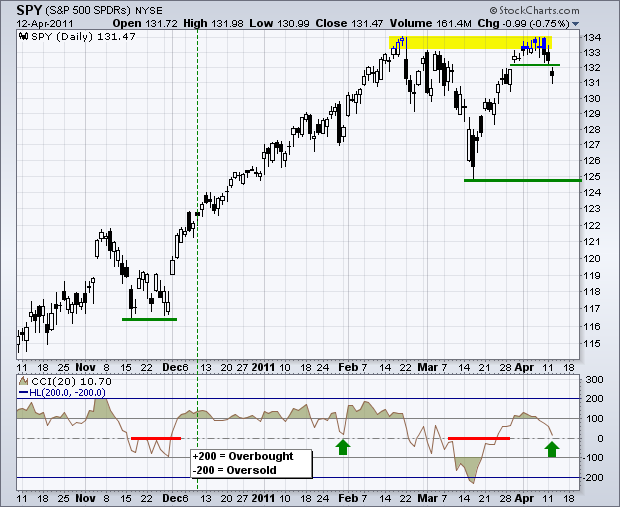
Art's Charts April 12, 2011 at 05:18 AM
There is not much change on the daily or 60-minute charts. The S&P 500 ETF (SPY) continues to battle resistance from the February high. Since moving above 132 on April 1st, the ETF stalled with five indecisive candlesticks and then two black candlesticks on Friday-Monday... Read More
Art's Charts April 12, 2011 at 05:15 AM
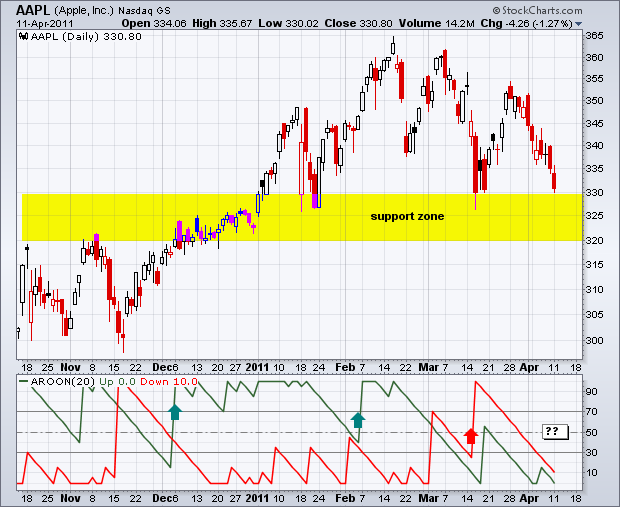
AAPL Hits Support Zone. AMGN Continues to Work Higher. BRCM Near Support and Key Retracement... Read More
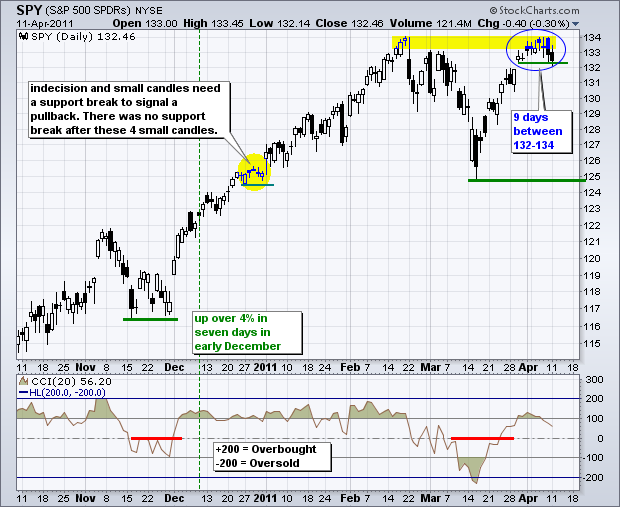
Art's Charts April 11, 2011 at 05:15 AM
On the daily chart, the S&P 500 ETF (SPY) continues to battle resistance from the February high. Since moving above 132 on April 1st, the ETF stalled with five indecisive candlesticks and then a long black candlestick on Friday... Read More
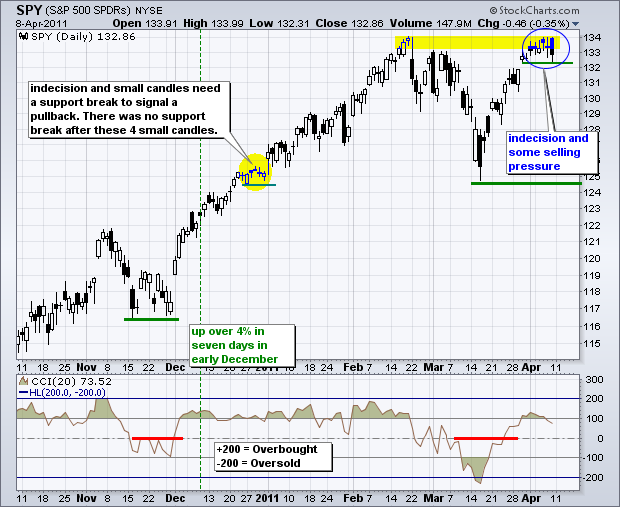
Art's Charts April 08, 2011 at 04:38 AM
While there are some discrepancies out there with various indicators, the weight of the evidence clearly favors the bulls. The NYSE AD Line hit a new high this week. Net New Highs expanded on both the NYSE and the Nasdaq. Small-caps are outperforming large-caps... Read More
Art's Charts April 08, 2011 at 03:54 AM
Bonds are breaking down and this is bullish for stocks. Stocks and bonds have been inversely correlated for some time now. Even though US interest rates are rising, the Dollar is falling and this is putting a bid into commodities. Strength in stocks is also helping commodities... Read More
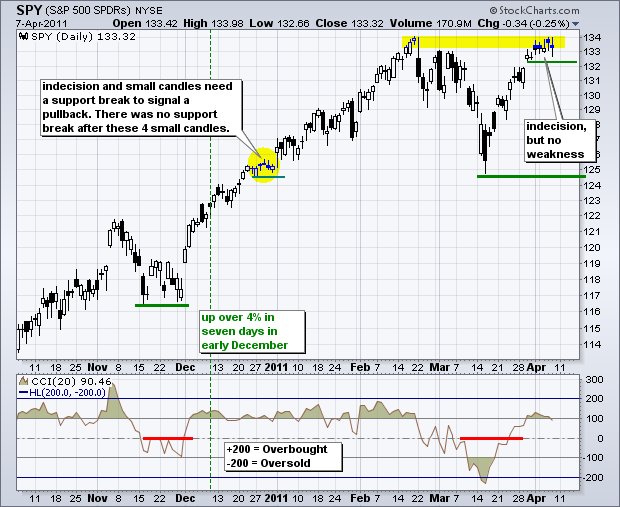
Art's Charts April 07, 2011 at 04:40 AM
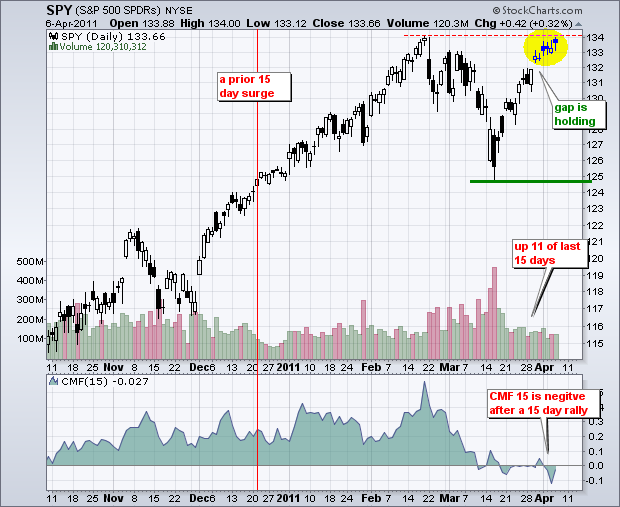
SPY is short-term overbought and at potential resistance from the February highs, but the overall trend remains up. In last night's Market Message, I pointed out that 15-day Chaikin Money Flow was negative despite a 7% surge the last 15 days. This is extraordinary... Read More
Art's Charts April 07, 2011 at 04:33 AM
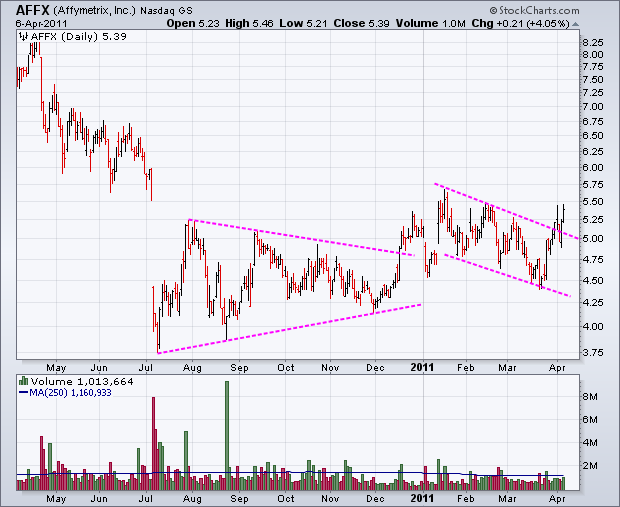
AFFX Breaks Resistance with Surge. GCI Forms Bear Flag. RF Challenges Resistance. Plus AKAM, AVP, PHM, $SVU, SYK and X ----------------------------------------------------------------------------- This commentary and charts-of-interest are designed to stimulate thinking... Read More
Art's Charts April 06, 2011 at 03:37 AM
There is not much change in the overall picture. Bond yields are in uptrends, Treasuries are in downtrends, the Dollar is weak, Gold is strong, Oil remains strong and Stocks are Strong. Even though some of these trends flatted over the last few days, they remain largely intact... Read More
Art's Charts April 05, 2011 at 06:18 AM
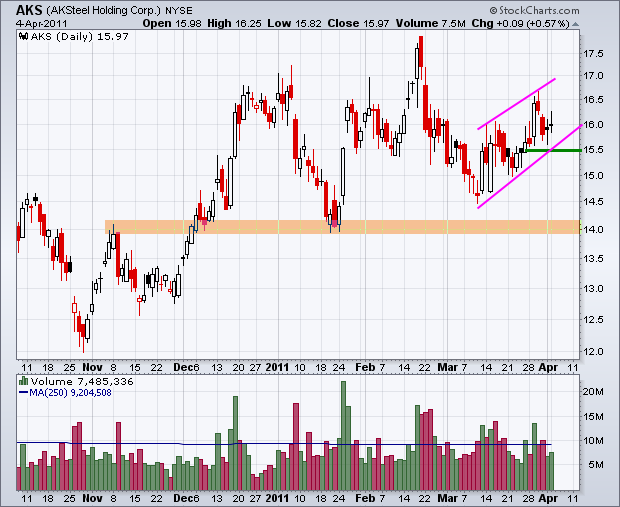
AKS forms Rising Wedge. GOOG Returns to Broken Support. WMT Consolidates after Surge. Plus EBAY,GTIV,NVLS,TTWO and WGO. ----------------------------------------------------------------------------- This commentary and charts-of-interest are designed to stimulate thinking... Read More
Art's Charts April 05, 2011 at 03:08 AM
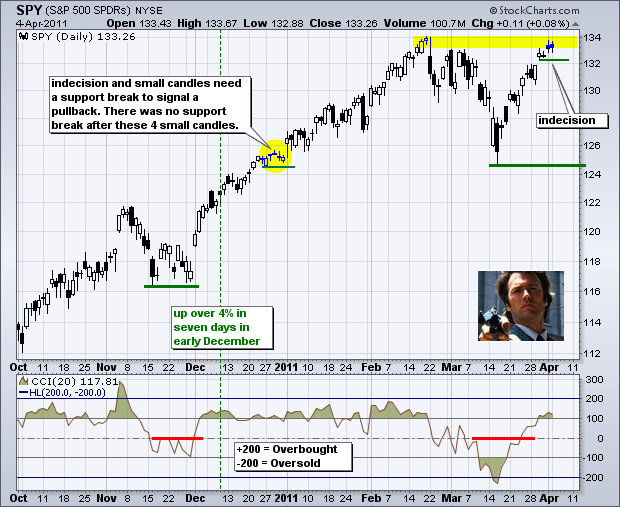
Clint Eastwood called this morning with a familiar question. Imagine the current uptrends speaking as Harry Calahan. Well, bear, do you feel lucky? Go ahead, bear, make my day... Read More
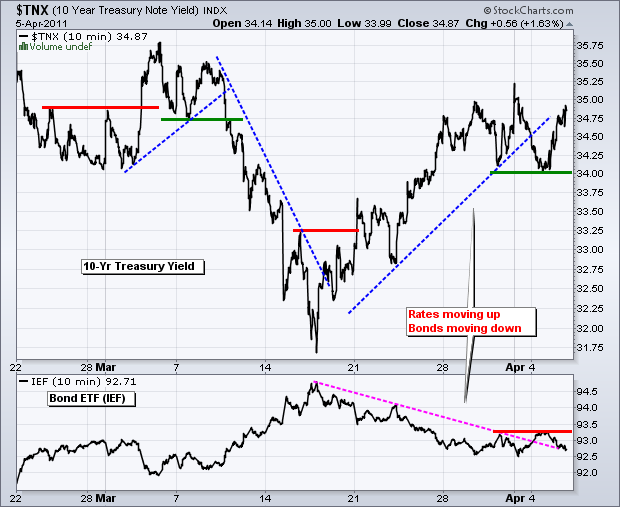
Art's Charts April 04, 2011 at 04:05 AM
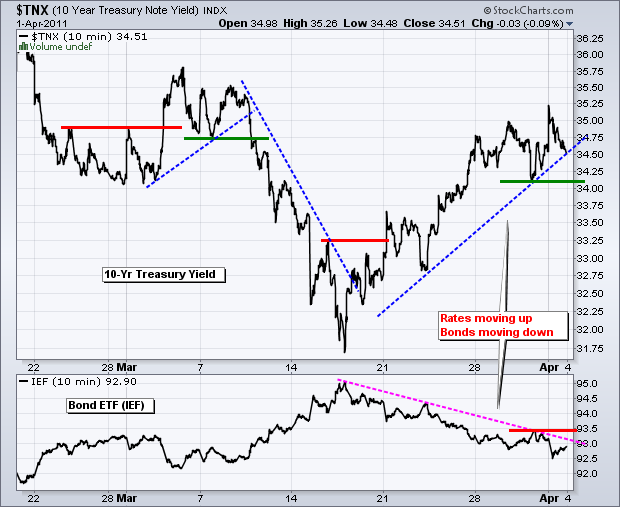
There are some well-defined short-term trends working over the last three weeks or so. Interest rates are moving up as bonds move lower. Oil is moving higher and the Dollar is moving lower. Stocks are trending up with small-caps leading the way... Read More
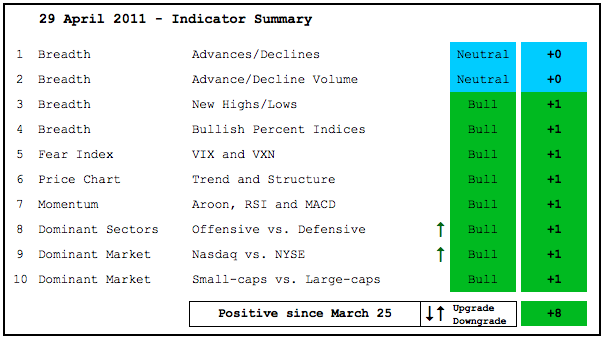
Art's Charts April 01, 2011 at 05:22 AM
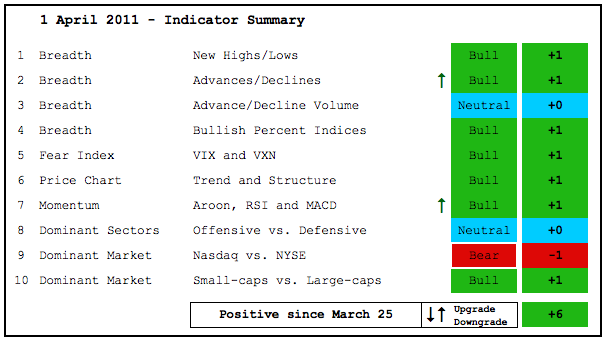
After a whipsaw in mid March, the indicator summary is back on its positive track with more strength this past week. The Nasdaq AD Line surged over the last 11 days and the NYSE AD Line hit a new 52-week high... Read More
Art's Charts April 01, 2011 at 04:42 AM
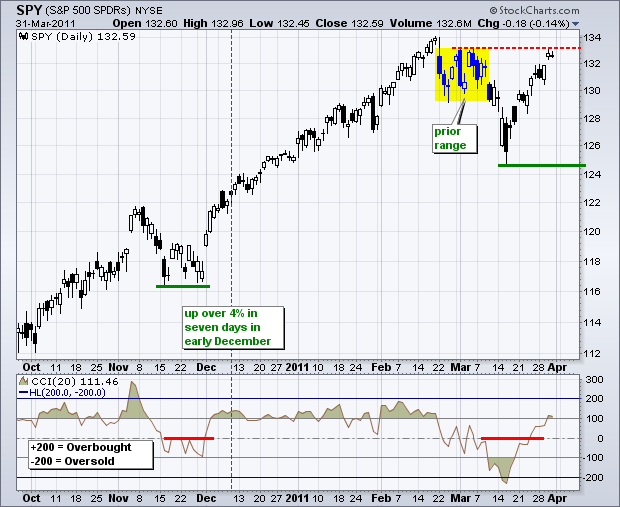
No change. Stocks remain strong. SPY is up over 5% the last 11 days. Small indecisive candlesticks formed after Wednesday's gap up, but the gap is holding... Read More